Since 2009, Backblaze has written extensively about the data storage servers we created and deployed which we call Backblaze Storage Pods. We not only wrote about our Storage Pods, we open sourced the design, published a parts list, and even provided instructions on how to build one. Many people did. Of the six storage pod versions we produced, four of them are still in operation in our data centers today. Over the last few years, we began using storage servers from Dell and, more recently, Supermicro, as they have proven to be economically and operationally viable in our environment.
Since 2013, we have also written extensively about our Drive Stats, sharing reports on the failure rates of the HDDs and SSDs in our legion of storage servers. We have examined the drive failure rates by manufacturer, size, age, and so on, but we have never analyzed the drive failure rates of the storage servers—until now. Let’s take a look at the Drive Stats for our fleet of storage servers and see what we can learn.
Storage Pods, Storage Servers, and Backblaze Vaults
Let’s start with a few definitions:
- Storage Server: A storage server is our generic name for a server from any manufacturer which we use to store customer data. We use storage servers from Backblaze, Dell, and Supermicro.
- Storage Pod: A Storage Pod is the name we gave to the storage servers Backblaze designed and had built for our data centers. The first Backblaze Storage Pod version was announced in September 2009. Subsequent versions are 2.0, 3.0, 4.0, 4.5, 5.0, 6.0, and 6.1. All but 6.1 were announced publicly.
- Backblaze Vault: A Backblaze Vault is 20 storage servers grouped together for the purpose of data storage. Uploaded data arrives at a given storage server within a Backblaze Vault and is encoded into 20 parts with a given part being either a data blob or parity. Each of the 20 parts (shards) is then stored on one of the 20 storage servers.
As you review the charts and tables here are a few things to know about Backblaze Vaults.
- There are currently six cohorts of storage servers in operation today: Supermicro, Dell, Backblaze 3.0, Backblaze 5.0, Backblaze 6.0, and Backblaze 6.1.
- A given Vault will always be made up from one of the six cohorts of storage servers noted above. For example, Vault 1016 is made up of 20 Backblaze 5.0 Storage Pods and Vault 1176 is made of the 20 Supermicro servers.
- A given Vault is made up of storage servers that contain the same number of drives as follows:
- Dell servers: 26 drives.
- Backblaze 3.0 and Backblaze 5.0 servers: 45 drives.
- Backblaze 6.0, Backblaze 6.1, and Supermicro servers: 60 drives.
- All of the hard drives in a Backblaze Vault will be logically the same size; so, 16TB drives for example.
Drive Stats by Backblaze Vault Cohort
With the background out of the way, let’s get started. As of the end of Q3 2023, there were a total of 241 Backblaze Vaults divided into the six cohorts, as shown in the chart below. The chart includes the server cohort, the number of Vaults in the cohort, and the percentage that cohort is of the total number of Vaults.
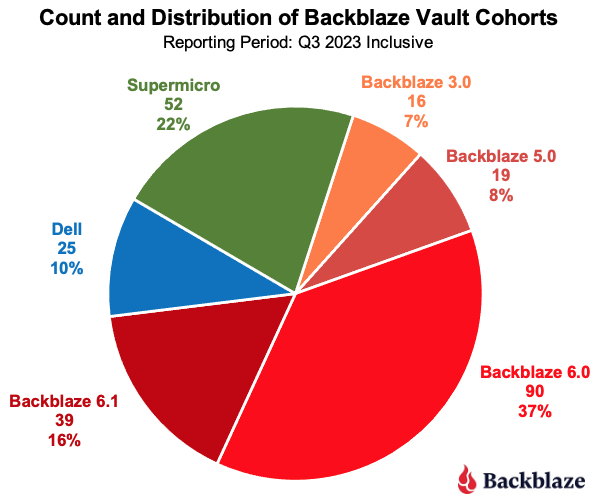
Vaults consisting of Backblaze servers still comprise 68% of the vaults in use today (shaded from orange to red), although that number is dropping as older Vaults are being replaced with newer server models, typically the Supermicro systems.
The table below shows the Drive Stats for the different Vault cohorts identified above for Q3 2023.
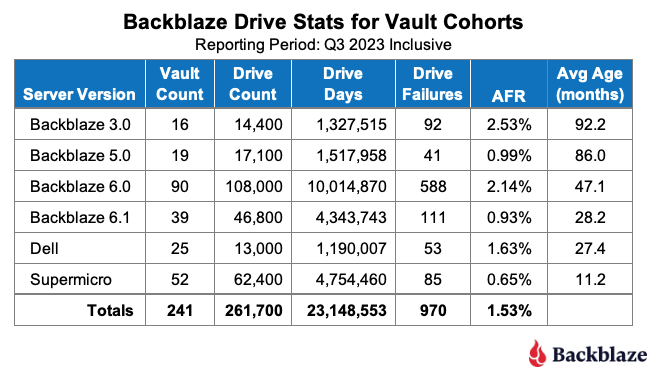
The Avg Age (months) column is the average age of the drives, not the average age of the Vaults. The two may seem to be related, that’s not entirely the case. It is true the Backblaze 3.0 Vaults were deployed first followed in order by the 5.0 and 6.0 Vaults, but that’s where things get messy. There was some overlap between the Dell and Backblaze 6.1 deployments as the Dell systems were deployed in our central Europe data center, while the 6.1 Vaults continued to be deployed in the U.S. In addition, some migrations from the Backblaze 3.0 Vaults were initially done to 6.1 Vaults while we were also deploying new drives in the Supermicro Vaults.
The AFR for each of the server versions does not seem to follow any pattern or correlation to the average age of the drives. This was unexpected because, in general, as drives pass about four years in age, they start to fail more often. This should mean that Vaults with older drives, especially those with drives whose average age is over four years (48 months), should have a higher failure rate. But, as we can see, the Backblaze 5.0 Vaults defy that expectation.
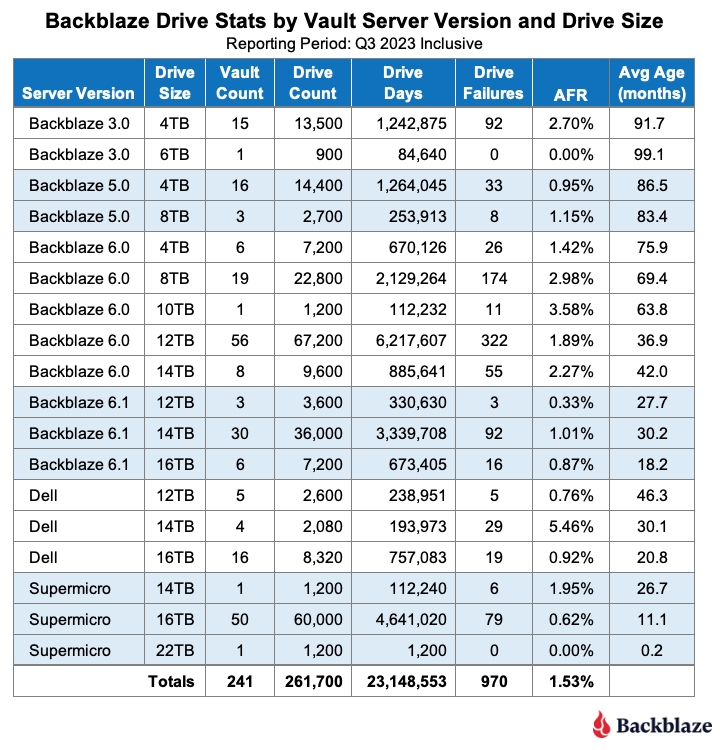
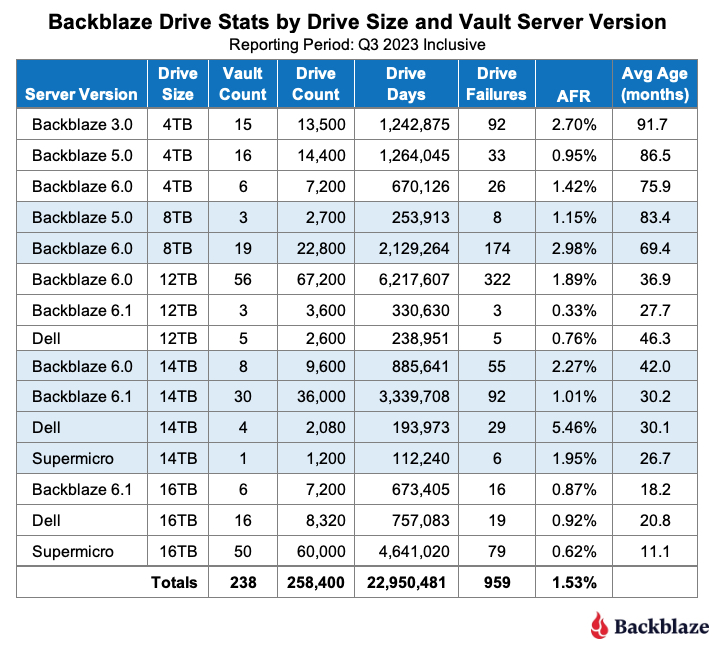
To see if we can determine what’s going on, let’s expand on the previous table and dig into the different drive sizes that are in each Vault cohort, as shown in the table below.
Observations for Each Vault Cohort
- Backblaze 3.0: Obviously these Vaults have the oldest drives and, given their AFR is nearly twice the average for all of the drives (1.53%), it would make sense to migrate off of these servers. Of course the 6TB drives seem to be the exception, but at some point they will most likely “hit the wall” and start failing.
- Backblaze 5.0: There are two Backblaze 5.0 drive sizes (4TB and 8TB) and the AFR for each is well below the average AFR for all of the drives (1.53%). The average age of the two drive sizes is nearly seven years or more. When compared to the Backblaze 6.0 Vaults, it would seem that migrating the 5.0 Vaults could wait, but there is an operational consideration here. The Backblaze 5.0 Vaults each contain 45 drives, and from the perspective of data density per system, they should be migrated to 60 drive servers sooner rather than later to optimize data center rack space.
- Backblaze 6.0: These Vaults as a group don’t seem to make any of the five different drive sizes happy. Only the AFR of the 4TB drives (1.42%) is just barely below the average AFR for all of the drives. The rest of the drive groups are well above the average.
- Backblaze 6.1: The 6.1 servers are similar to the 6.0 servers, but with an upgraded CPU and faster NIC cards. Is that why their annualized failure rates are much lower than the 6.0 systems? Maybe, but the drives in the 6.1 systems are also much younger, about half the age of those in the 6.0 systems, so we don’t have the full picture yet.
- Dell: The 14TB drives in the Dell Vaults seem to be a problem at a 5.46% AFR. Much of that is driven by two particular Dell vaults which have a high AFR, over 8% for Q3. This appears to be related to their location in the data center. All 40 of the Dell servers which make up these two Vaults were relocated to the top of 52U racks, and it appears that initially they did not like their new location. Recent data indicates they are doing much better, and we’ll publish that data soon. We’ll need to see what happens over the next few quarters. That said, if you remove these two Vaults from the Dell tally, the AFR is a respectable 0.99% for the remaining Vaults.
- Supermicro: This server cohort is mostly 16TB drives which are doing very well with an AFR of 0.62%. The one 14TB Vault is worth our attention with an AFR of 1.95%, and the 22TB Vault is too new to do any analysis.
Drive Stats by Drive Size and Vault Cohort
Another way to look at the data is to take the previous table and re-sort it by drive size. Before we do that let’s establish the AFR for the different drive sizes aggregated over all Vaults.
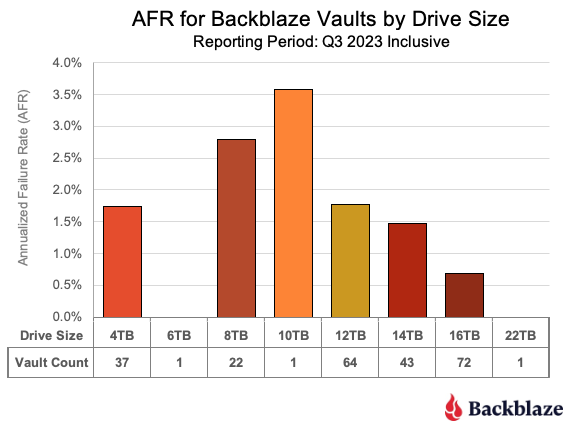
As we can see in Q3 the 6TB and 22TB Vaults had zero failures (AFR = 0%). Also, the 10TB Vault is indeed only one Vault, so there are no other 10TB Vaults to compare it to. Given this, for readability, we will remove the 6TB, 10TB, and 22TB Vaults from the next table which compares how each drive size has fared in each of the six different Vault cohorts.
Currently we are migrating the 4TB drive Vaults to larger Vaults, replacing them with drives of 16TB and above. The migrations are done using an in-house system which we’ll expand upon in a future post. The specific order of migrations is based on failure rates and durability of the existing 4TB Vaults with an eye towards removing the Backblaze 3.0 systems first as they are nearly 10 years old in some cases, and many of the non-drive replacement parts are no longer available. Whether we give away, destroy, or recycle the retired Backblaze 3.0 Storage Pods (sans drives) is still being debated.
For the 8TB drive Vaults, the Backblaze 5.0 Vaults are up first for migration when the time comes. Yes, their AFR is lower then the Backblaze 6.0 Vaults, but remember: the 5.0 Vaults are 45 drive units which are not as efficient storage density-wise versus the 60 drive systems.
Speaking of systems with less than 60 drives, the Dell servers are 26 drives. Those 26 drives are in a 2U chassis versus a 4U chassis for all of the other servers. The Dell servers are not quite as dense as the 60 drive units, but their 2U form factor gives us some flexibility in filling racks, especially when you add utility servers (1U or 2U) and networking gear to the mix. That’s one of the reasons the two Dell Vaults we noted earlier were moved to the top of the 52U racks. FYI, those two Vaults hold 14TB drives and are two of the four 14TB Dell Vaults making up the 5.46% AFR. The AFR for the Dell Vaults with 12TB and 16TB drives is 0.76% and 0.92% respectively. As noted earlier, we expect the AFR for 14TB Dell Vaults to drop over the coming months.
What Have We Learned?
Our goal today was to see what we can learn about the drive failure rates of the storage servers we use in our data centers. All of our storage servers are grouped in operational systems we call Backblaze Vaults. There are six different cohorts of storage servers with each vault being composed of the same type of storage server, hence there are six types of vaults.
As we dug into data, we found that the different cohorts of Vaults had different annualized failure rates. What we didn’t find was a correlation between the age of the drives used in the servers and the annualized failure rates of the different Vault cohorts. For example, the Backblaze 5.0 Vaults have a much lower AFR of 0.99% versus the Backblaze 6.0 Vault AFR at 2.14%—even though the drives in the 5.0 Vaults are nearly twice as old on average than the drives in the 6.0 Vaults.
This suggests that while our initial foray into the annualized failure rates of the different Vault cohorts is a good first step, there is more to do here.
Where Do We Go From Here?
In general, all of the Vaults in a given cohort were manufactured to the same specifications, used the same parts, and were assembled using the same processes. One obvious difference is that different drive models are used in each Vault cohort. For example, the 16TB vaults are composed of seven different drive models. Do some drive models work better in one Vault cohort versus another? Over the next couple of quarters we’ll dig into the data and let you know what we find. Hopefully it will add to our understanding of the annualized failures rates of the different Vault cohorts. Stay tuned.