At the end of Q3 2023, Backblaze was monitoring 263,992 hard disk drives (HDDs) and solid state drives (SSDs) in our data centers around the world. Of that number, 4,459 are boot drives, with 3,242 being SSDs and 1,217 being HDDs. The failure rates for the SSDs are analyzed in the SSD Edition: 2023 Drive Stats review.
That leaves us with 259,533 HDDs that we’ll focus on in this report. We’ll review the quarterly and lifetime failure rates of the data drives as of the end of Q3 2023. Along the way, we’ll share our observations and insights on the data presented, and, for the first time ever, we’ll reveal the drive failure rates broken down by data center.
Q3 2023 Hard Drive Failure Rates
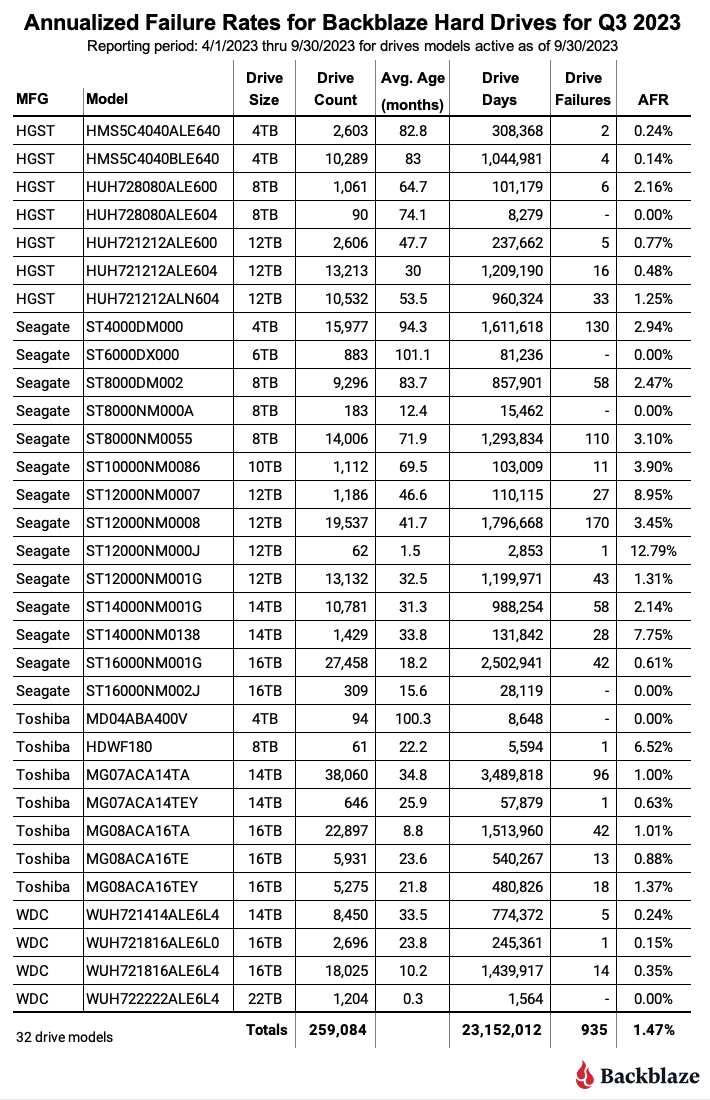
At the end of Q3 2023, we were managing 259,533 hard drives used to store data. For our review, we removed 449 drives from consideration as they were used for testing purposes, or were drive models which did not have at least 60 drives. This leaves us with 259,084 hard drives grouped into 32 different models.
The table below reviews the annualized failure rate (AFR) for those drive models for the Q3 2023 time period.
Notes and Observations on the Q3 2023 Drive Stats
- The 22TB drives are here: At the bottom of the list you’ll see the WDC 22TB drives (model: WUH722222ALE6L4). A Backblaze Vault of 1,200 drives (plus four) is now operational. The 1,200 drives were installed on September 29, so they only have one day of service each in this report, but zero failures so far.
- The old get bolder: At the other end of the time-in-service spectrum are the 6TB Seagate drives (model: ST6000DX000) with an average of 101 months in operation. This cohort had zero failures in Q3 2023 with 883 drives and a lifetime AFR of 0.88%.
- Zero failures: In Q3, six different drive models managed to have zero drive failures during the quarter. But only the 6TB Seagate, noted above, had over 50,000 drive days, our minimum standard for ensuring we have enough data to make the AFR plausible.
- One failure: There were four drive models with one failure during Q3. After applying the 50,000 drive day metric, two drives stood out:
- WDC 16TB (model: WUH721816ALE6L0) with a 0.15% AFR.
- Toshiba 14TB (model: MG07ACA14TEY) with a 0.63% AFR.
The Quarterly AFR Drops
In Q3 2023, quarterly AFR for all drives was 1.47%. That was down from 2.2% in Q2 and also down from 1.65% a year ago. The quarterly AFR is based on just the data in that quarter, so it can often fluctuate from quarter to quarter.
In our Q2 2023 report, we suspected the 2.2% for the quarter was due to the overall aging of the drive fleet and in particular we pointed a finger at specific 8TB, 10TB, and 12TB drive models as potential culprits driving the increase. That prediction fell flat in Q3 as nearly two-thirds of drive models experienced a decreased AFR quarter over quarter from Q2 and any increases were minimal. This included our suspect 8TB, 10TB, and 12TB drive models.
It seems Q2 was an anomaly, but there was one big difference in Q3: we retired 4,585 aging 4TB drives. The average age of the retired drives was just over eight years, and while that was a good start, there’s another 28,963 4TB drives to go. To facilitate the continuous retirement of aging drives and make the data migration process easy and safe we use CVT, our awesome in-house data migration software which we’ll cover at another time.
A Hot Summer and the Drive Stats Data
As anyone should in our business, Backblaze continuously monitors our systems and drives. So, it was of little surprise to us when the folks at NASA confirmed the summer of 2023 as Earth’s hottest on record. The effects of this record-breaking summer showed up in our monitoring systems in the form of drive temperature alerts. A given drive in a storage server can heat up for many reasons: it is failing; a fan in the storage server has failed; other components are producing additional heat; the air flow is somehow restricted; and so on. Add in the fact that the ambient temperature within a data center often increases during the summer months, and you can get more temperature alerts.
In reviewing the temperature data for our drives in Q3, we noticed that a small number of drives exceeded the maximum manufacturer’s temperature for at least one day. The maximum temperature for most drives is 60°C, except for the 12TB, 14TB, and 16TB Toshiba drives which have a maximum temperature of 55°C. Of the 259,533 data drives in operation in Q3, there were 354 individual drives (0.0013%) that exceeded their maximum manufacturer temperature. Of those only two drives failed, leaving 352 drives which were still operational as of the end of Q3.
While temperature fluctuation is part of running data centers and temp alerts like these aren’t unheard of, our data center teams are looking into the root causes to ensure we’re prepared for the inevitability of increasingly hot summers to come.
Will the Temperature Alerts Affect Drive Stats?
The two drives which exceeded their maximum temperature and failed in Q3 have been removed from the Q3 AFR calculations. Both drives were 4TB Seagate drives (model: ST4000DM000). Given that the remaining 352 drives which exceeded their temperature maximum did not fail in Q3, we have left them in the Drive Stats calculations for Q3 as they did not increase the computed failure rates.
Beginning in Q4, we will remove the 352 drives from the regular Drive Stats AFR calculations and create a separate cohort of drives to track that we’ll name Hot Drives. This will allow us to track the drives which exceeded their maximum temperature and compare their failure rates to those drives which operated within the manufacturer’s specifications. While there are a limited number of drives in the Hot Drives cohort, it could give us some insight into whether drives being exposed to high temperatures could cause a drive to fail more often. This heightened level of monitoring will identify any increase in drive failures so that they can be detected and dealt with expeditiously.
New Drive Stats Data Fields in Q3
In Q2 2023, we introduced three new data fields that we started populating in the Drive Stats data we publish: vault_id, pod_id, and is_legacy_format. In Q3, we are adding three more fields into each drive records as follows:
datacenter: The Backblaze data center where the drive is installed, currently one of these values:ams5,iad1,phx1,sac0, andsac2.cluster_id: The name of a given collection of storage servers logically grouped together to optimize system performance. Note: At this time thecluster_idis not always correct, we are working on fixing that.pod_slot_num: The physical location of a drive within a storage server. The specific slot differs based on the storage server type and capacity: Backblaze (45 drives), Backblaze (60 drives), Dell (26 drives), or Supermicro (60 drives). We’ll dig into these differences in another post.
With these additions, the new schema beginning in Q3 2023 is:
dateserial_numbermodelcapacity_bytesfailuredatacenter(Q3)cluster_id(Q3)vault_id(Q2)pod_id(Q2)pod_slot_num(Q3)is_legacy_format(Q2)smart_1_normalizedsmart_1_raw- The remaining SMART value pairs (as reported by each drive model)
Beginning in Q3, these data data fields have been added to the publicly available Drive Stats files that we publish each quarter.
Failure Rates by Data Center
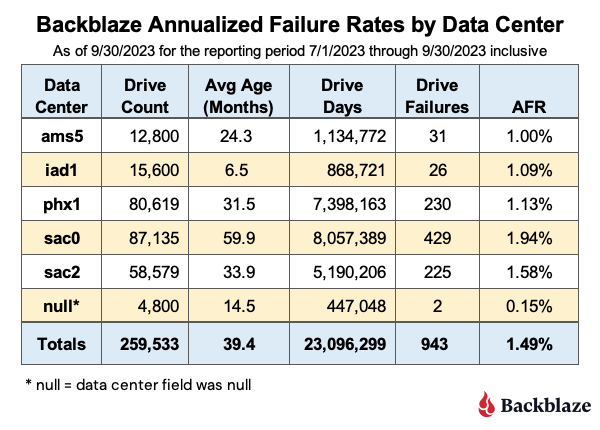
Now that we have the data center for each drive we can compute the AFRs for the drives in each data center. Below you’ll find the AFR for each of five data centers for Q3 2023.
Notes and Observations
- Null?: The drives which reported a null or blank value for their data center are grouped in four Backblaze vaults. David, the Senior Infrastructure Software Engineer for Drive Stats, described the process of how we gather all the parts of the Drive Stats data each day. The TL:DR is that vaults can be too busy to respond at the moment we ask, and since the data center field is nice-to-have data, we get a blank field. We can go back a day or two to find the data center value, which we will do in the future when we report this data.
- sac0?: sac0 has the highest AFR of all of the data centers, but it also has the oldest drives—nearly twice as old, on average, versus the next closest in data center, sac2. As discussed previously, drive failures do seem to follow the “bathtub curve”, although recently we’ve seen the curve start out flatter. Regardless, as drive models age, they do generally fail more often. Another factor could be that sac0, and to a lesser extent sac2, has some of the oldest Storage Pods, including a handful of 45-drive units. We are in the process of using CVT to replace these older servers while migrating from 4TB to 16TB and larger drives.
- iad1: The iad data center is the foundation of our eastern region and has been growing rapidly since coming online about a year ago. The growth is a combination of new data and customers using our cloud replication capability to automatically make a copy of their data in another region.
- Q3 Data: This chart is for Q3 data only and includes all the data drives, including those with less than 60 drives per model. As we track this data over the coming quarters, we hope to get some insight into whether different data centers really have different drive failure rates, and, if so, why.
Lifetime Hard Drive Failure Rates
As of September 30, 2023, we were tracking 259,084 hard drives used to store customer data. For our lifetime analysis, we collect the number of drive days and the number of drive failures for each drive beginning from the time a drive was placed into production in one of our data centers. We group these drives by model, then sum up the drive days and failures for each model over their lifetime. That chart is below.
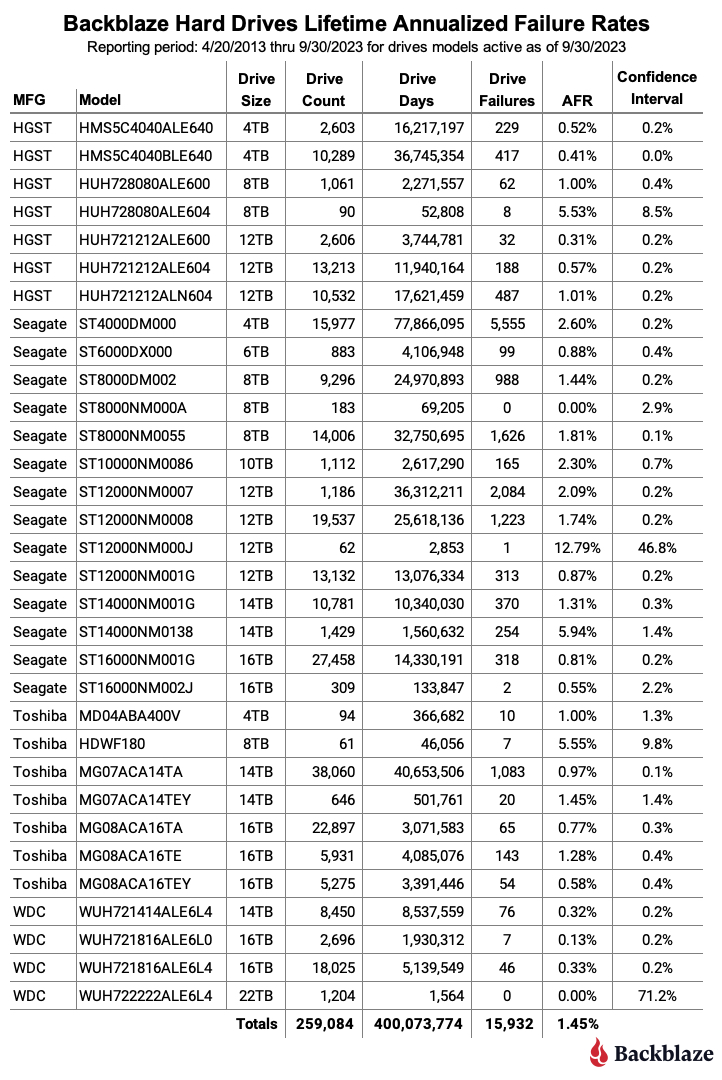
One of the most important columns on this chart is the confidence interval, which is the difference between the low and high AFR confidence levels calculated at 95%. The lower the value, the more certain we are of the AFR stated. We like a confidence interval to be 0.5% or less. When the confidence interval is higher, that is not necessarily bad, it just means we either need more data or the data is somewhat inconsistent.
The table below contains just those drive models which have a confidence interval of less than 0.5%. We have sorted the list by drive size and then by AFR.
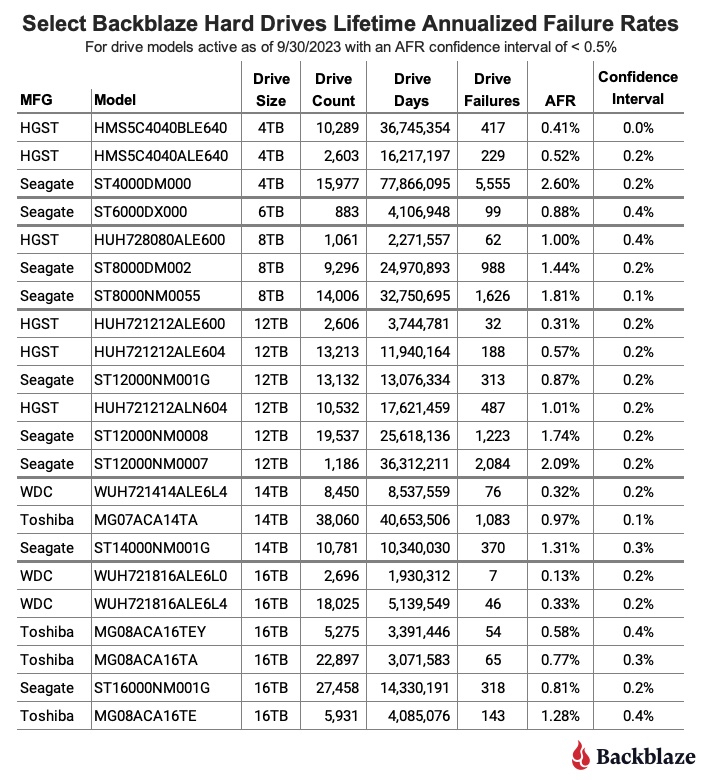
The 4TB, 6TB, 8TB, and some of the 12TB drive models are no longer in production. The HGST 12TB models in particular can still be found, but they have been relabeled as Western Digital and given alternate model numbers. Whether they have materially changed internally is not known, at least to us.
One final note about the lifetime AFR data: you might have noticed the AFR for all of the drives hasn’t changed much from quarter to quarter. It has vacillated between 1.39% to 1.45% percent for the last two years. Basically, we have lots of drives with lots of time-in-service so it is hard to move the needle up or down. While the lifetime stats for individual drive models can be very useful, the lifetime AFR for all drives will probably get less and less interesting as we add more and more drives. Of course, a few hundred thousand drives that never fail could arrive, so we will continue to calculate and present the lifetime AFR.
The Hard Drive Stats Data
The complete data set used to create the information used in this review is available on our Hard Drive Stats Data webpage. You can download and use this data for free for your own purpose. All we ask are three things: 1) you cite Backblaze as the source if you use the data, 2) you accept that you are solely responsible for how you use the data, and 3) you do not sell this data to anyone; it is free.
Good luck and let us know if you find anything interesting.