Welcome to the 2023 Mid-Year SSD Edition of the Backblaze Drive Stats review. This report is based on data from the solid state drives (SSDs) we use as storage server boot drives on our Backblaze Cloud Storage platform. In this environment, the drives do much more than boot the storage servers. They also store log files and temporary files produced by the storage server. Each day a boot drive will read, write, and delete files depending on the activity of the storage server itself.
We will review the quarterly and lifetime failure rates for these drives, and along the way we’ll offer observations and insights to the data presented. In addition, we’ll take a first look at the average age at which our SSDs fail, and examine how well SSD failure rates fit the ubiquitous bathtub curve.
Mid-Year SSD Results by Quarter
As of June 30, 2023, there were 3,144 SSDs in our storage servers. This compares to 2,558 SSDs we reported in our 2022 SSD annual report. We’ll start by presenting and discussing the quarterly data from each of the last two quarters (Q1 2023 and Q2 2023).
Notes and Observations
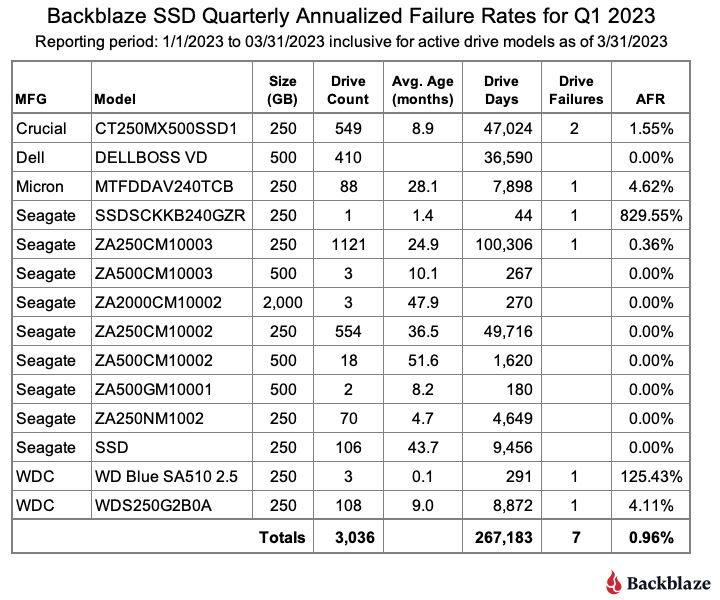
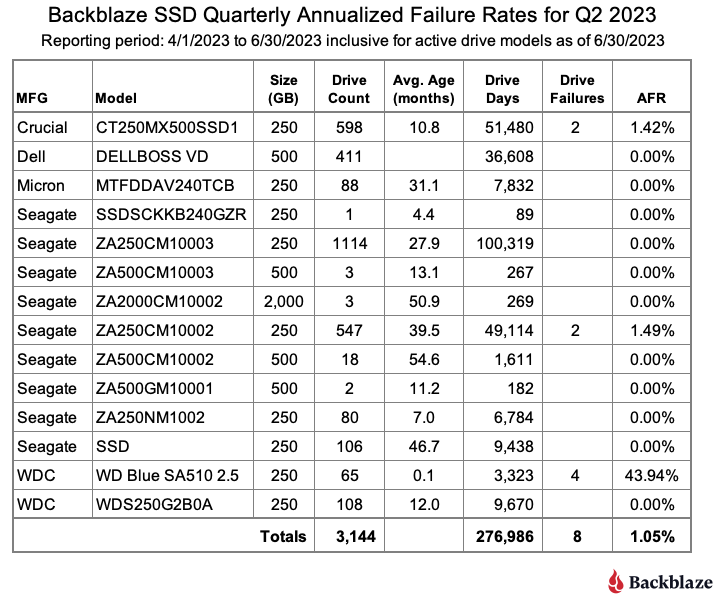
Data is by quarter: The data used in each table is specific to that quarter. That is, the number of drive failures and drive days are inclusive of the specified quarter, Q1 or Q2. The drive counts are as of the last day of each quarter.
Drives added: Since our last SSD report, ending in Q4 2022, we added 238 SSD drives to our collection. Of that total, the Crucial (model: CT250MX500SSD1) led the way with 110 new drives added, followed by 62 new WDC drives (model: WD Blue SA510 2.5) and 44 Seagate drives (model: ZA250NM1000).
Really high annualized failure rates (AFR): Some of the failure rates, that is AFR, seem crazy high. How could the Seagate model SSDSCKKB240GZR have an annualized failure rate over 800%? In that case, in Q1, we started with two drives and one failed shortly after being installed. Hence, the high AFR. In Q2, the remaining drive did not fail and the AFR was 0%. Which AFR is useful? In this case neither, we just don’t have enough data to get decent results. For any given drive model, we like to see at least 100 drives and 10,000 drive days in a given quarter as a minimum before we begin to consider the calculated AFR to be “reasonable.” We include all of the drive models for completeness, so keep an eye on drive count and drive days before you look at the AFR with a critical eye.
Quarterly Annualized Failures Rates Over Time
The data in any given quarter can be volatile with factors like drive age and the randomness of failures factoring in to skew the AFR up or down. For Q1, the AFR was 0.96% and, for Q2, the AFR was 1.05%. The chart below shows how these quarterly failure rates relate to previous quarters over the last three years.
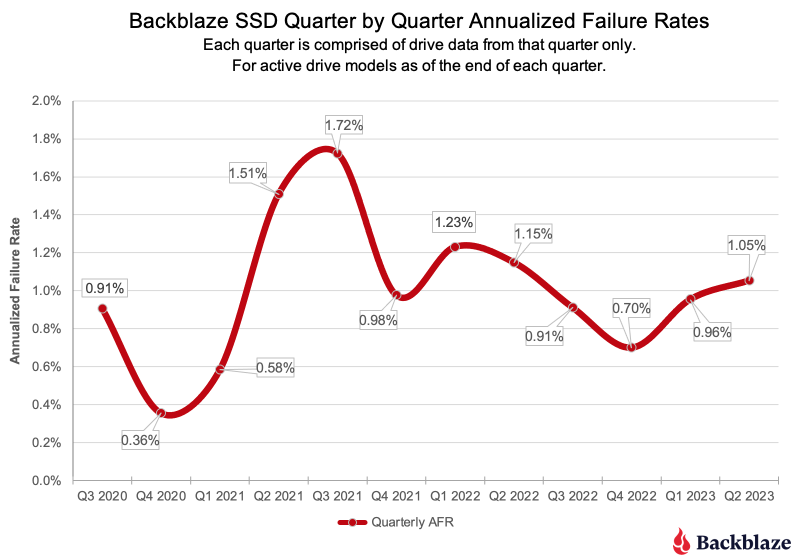
As you can see, the AFR fluctuates between 0.36% and 1.72%, so what’s the value of quarterly rates? Well, they are useful as the proverbial canary in a coal mine. For example, the AFR in Q1 2021 (0.58%) jumped 1.51% in Q2 2021, then to 1.72% in Q3 2021. A subsequent investigation showed one drive model was the primary cause of the rise and that model was removed from service.
It happens from time to time that a given drive model is not compatible with our environment, and we will moderate or even remove that drive’s effect on the system as a whole. While not as critical as data drives in managing our system’s durability, we still need to keep boot drives in operation to collect the drive/server/vault data they capture each day.
How Backblaze Uses the Data Internally
As you’ve seen in our SSD and HDD Drive Stats reports, we produce quarterly, annual, and lifetime charts and tables based on the data we collect. What you don’t see is that every day we produce similar charts and tables for internal consumption. While typically we produce one chart for each drive model, in the example below we’ve combined several SSD models into one chart.
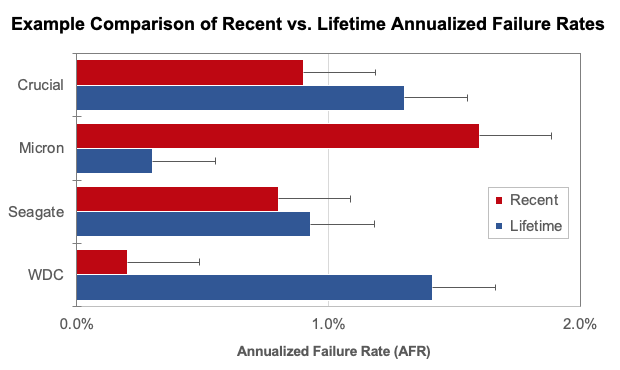
The “Recent” period we use internally is 60 days. This differs from our public facing reports which are quarterly. In either case, charts like the one above allow us to quickly see trends requiring further investigation. For example, in our chart above, the recent results of the Micron SSDs indicate a deeper dive into the data behind the charts might be necessary.
By collecting, storing, and constantly analyzing the Drive Stats data we can be proactive in maintaining our durability and availability goals. Without our Drive Stats data, we would be inclined to over-provision our systems as we would be blind to the randomness of drive failures which would directly impact those goals.
A First Look at More SSD Stats
Over the years in our quarterly Hard Drive Stats reports, we’ve examined additional metrics beyond quarterly and lifetime failure rates. Many of these metrics can be applied to SSDs as well. Below we’ll take a first look at two of these: the average age of failure for SSDs and how well SSD failures correspond to the bathtub curve. In both cases, the datasets are small, but are a good starting point as the number of SSDs we monitor continues to increase.
The Average Age of Failure for SSDs
Previously, we calculated the average age at which a hard drive in our system fails. In our initial calculations that turned out to be about two years and seven months. That was a good baseline, but further analysis was required as many of the drive models used in the calculations were still in service and hence some number of them could fail, potentially affecting the average.
We are going to apply the same calculations to our collection of failed SSDs and establish a baseline we can work from going forward. Our first step was to determine the SMART_9_RAW value (power-on-hours or POH) for the 63 failed SSD drives we have to date. That’s not a great dataset size, but it gave us a starting point. Once we collected that information, we computed that the average age of failure for our collection of failed SSDs is 14 months. Given that the average age of the entire fleet of our SSDs is just 25 months, what should we expect to happen as the average age of the SSDs still in operation increases? The table below looks at three drive models which have a reasonable amount of data.
| Good Drives | Failed Drives | ||||
| MFG | Model | Count | Avg Age | Count | Avg Age |
| Crucial | CT250MX500SSD1 | 598 | 11 months | 9 | 7 months |
| Seagate | ZA250CM10003 | 1,114 | 28 months | 14 | 11 months |
| Seagate | ZA250CM10002 | 547 | 40 months | 17 | 25 months |
As we can see in the table, the average age of the failed drives increases as the average age of drives in operation (good drives) increases. In other words, it is reasonable to expect that the average age of SSD failures will increase as the entire fleet gets older.
Is There a Bathtub Curve for SSD Failures?
Previously we’ve graphed our hard drive failures over time to determine their fit to the classic bathtub curve used in reliability engineering. Below, we used our SSD data to determine how well our SSD failures fit the bathtub curve.
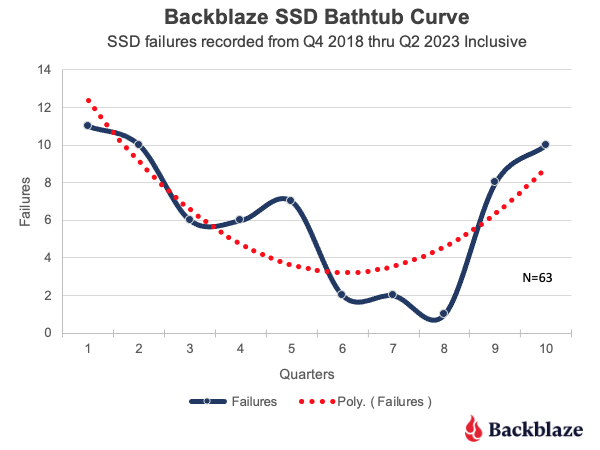
While the actual curve (blue line) produced by the SSD failures over each quarter is a bit “lumpy”, the trend line (second order polynomial) does have a definite bathtub curve look to it. The trend line is about a 70% match to the data, so we can’t be too confident of the curve at this point, but for the limited amount of data we have, it is surprising to see how the occurrences of SSD failures are on a path to conform to the tried-and-true bathtub curve.
SSD Lifetime Annualized Failure Rates
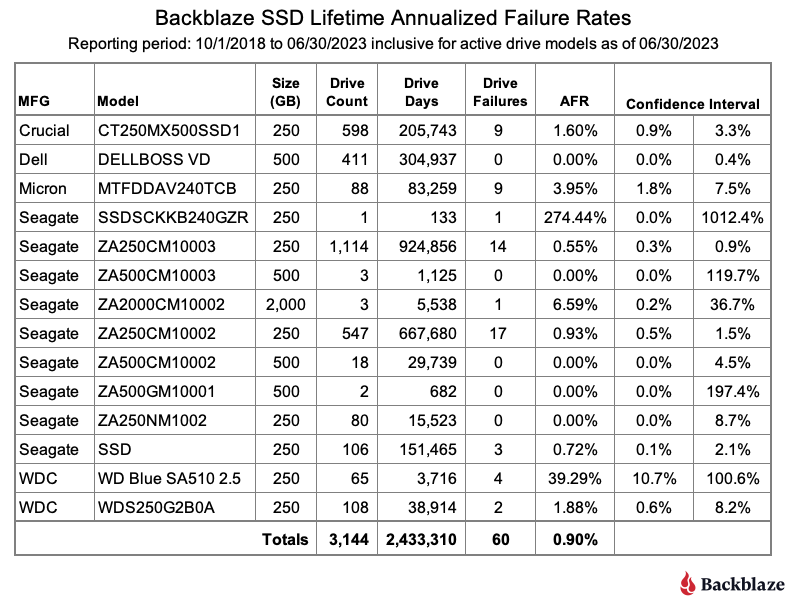
As of June 30, 2023, there were 3,144 SSDs in our storage servers. The table below is based on the lifetime data for the drive models which were active as of the end of Q2 2023.
Notes and Observations
Lifetime AFR: The lifetime data is cumulative from Q4 2018 through Q2 2023. For this period, the lifetime AFR for all of our SSDs was 0.90%. That was up slightly from 0.89% at the end of Q4 2022, but down from a year ago, Q2 2022, at 1.08%.
High failure rates?: As we noted with the quarterly stats, we like to have at least 100 drives and over 10,000 drive days to give us some level of confidence in the AFR numbers. If we apply that metric to our lifetime data, we get the following table.
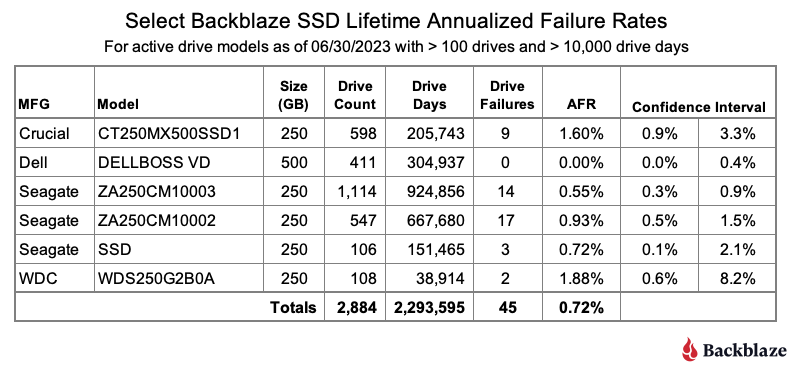
Applying our modest criteria to the list eliminated those drive models with crazy high failure rates. This is not a statistics trick; we just removed those models which did not have enough data to make the calculated AFR reliable. It is possible the drive models we removed will continue to have high failure rates. It is also just as likely their failure rates will fall into a more normal range. If this technique seems a bit blunt to you, then confidence intervals may be what you are looking for.
Confidence intervals: In general, the more data you have and the more consistent that data is, the more confident you are in the predictions based on that data. We calculate confidence intervals at 95% certainty.
For SSDs, we like to see a confidence interval of 1.0% or less between the low and the high values before we are comfortable with the calculated AFR. If we apply this metric to our lifetime SSD data we get the following table.
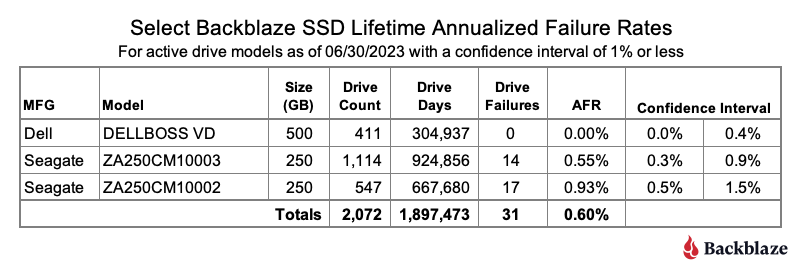
This doesn’t mean the failure rates for the drive models with a confidence interval greater than 1.0% are wrong; it just means we’d like to get more data to be sure.
Regardless of the technique you use, both are meant to help clarify the data presented in the tables throughout this report.
The SSD Stats Data
The data collected and analyzed for this review is available on our Drive Stats Data page. You’ll find SSD and HDD data in the same files and you’ll have to use the model number to locate the drives you want, as there is no field to designate a drive as SSD or HDD. You can download and use this data for free for your own purpose. All we ask are three things: 1) you cite Backblaze as the source if you use the data, 2) you accept that you are solely responsible for how you use the data, and 3) you do not sell this data to anyone—it is free.
Good luck and let us know if you find anything interesting.