We published our first “Hard Drive Stats” report just over 5 years ago on January 21, 2014. We titled that report “What Hard Drive Should I Buy.” In hindsight, that might have been a bit of an overreach, but we were publishing data that was basically non-existent otherwise.Many people like our reports, some don’t, and some really don’t — and that’s fine. From the beginning, the idea was to share our experience and use our data to shine a light on the otherwise opaque world of hard disk drives. We hope you have enjoyed reading our reports and we look forward to publishing them for as long as people find them useful.
Thank you.
As of December 31, 2018, we had 106,919 spinning hard drives. Of that number, there were 1,965 boot drives and 104,954 data drives. This review looks at the hard drive failure rates for the data drive models in operation in our data centers. In addition, we’ll take a look at the new hard drive models we’ve added in 2018 including our 12 TB HGST and 14 TB Toshiba drives. Along the way we’ll share observations and insights on the data presented and we look forward to you doing the same in the comments.
2018 Hard Drive Failure Rates: What 100,000+ Hard Drives Tell Us
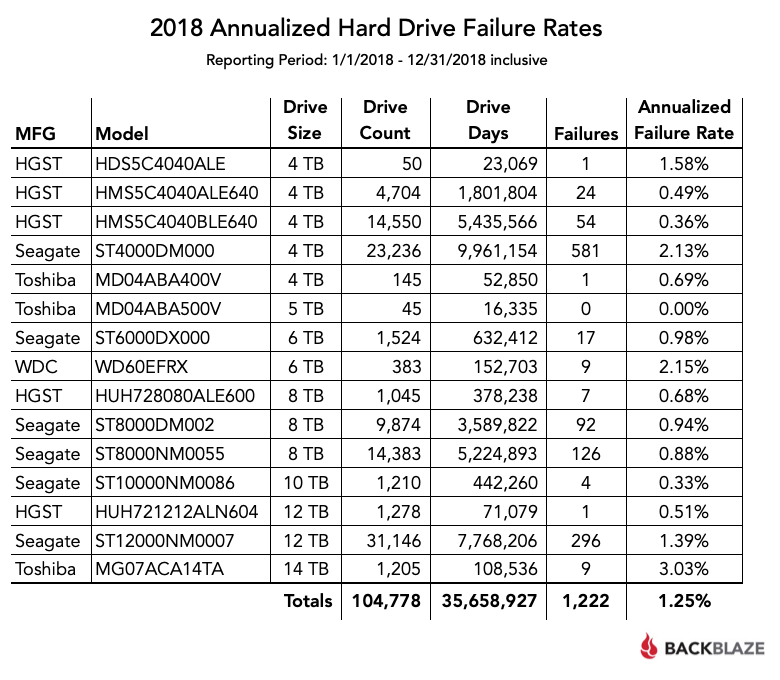
At the end of 2018 Backblaze was monitoring 104,954 hard drives used to store data. For our evaluation we remove from consideration those drives that were used for testing purposes and those drive models for which we did not have at least 45 drives (see why below). This leaves us with 104,778 hard drives. The table below covers what happened just in 2018.
Notes and Observations
If a drive model has a failure rate of 0%, it means there were no drive failures of that model during 2018.
For 2018, the Annualized Failure Rate (AFR) stated is usually pretty solid. The exception is when a given drive model has a small number of drives (fewer than 500) and/or a small number of drive days (fewer than 50,000). In these cases, the APR can be too wobbly to be used reliably for buying or retirement decisions.
There were 176 drives (104,954 minus 104,778) that were not included in the list above. These drives were either used for testing or we did not have at least 45 drives of a given model. We use 45 drives of the same model as the minimum number when we report quarterly, yearly, and lifetime drive statistics. This is a historical number based on the number of drives needed to fill one Backblaze Storage Pod (version 5 or earlier).
The Annualized Failure Rate (AFR) for 2018 for all drive models was just 1.25%, well below the rates from previous years as we’ll discuss later on in this review.
What’s New in 2018
In 2018 the big trend was hard drive migration: replacing lower density 2, 3, and 4 TB drives, with 8, 10, 12, and in Q4, 14 TB drives. In 2018 we migrated 13,720 hard drives and we added another 13,389 hard drives as we increased our total storage from about 500 petabytes to over 750 petabytes. So in 2018, our data center techs migrated or added 75 drives a day on average, every day of the year.
Here’s a quick review of what’s new in 2018.
- There are no more 4 TB Western Digital drives; the last of them was replaced in Q4. This leaves us with only 383 Western Digital drives remaining — all 6 TB drives. That’s 0.37% of our drive farm. We do have plenty of drives from HGST (owned by WDC), but over the years we’ve never been able to get the quantity of Western Digital drives we need at a reasonable price.
- Speaking of HGST drives, in Q4 we added 1,200 HGST 12 TB drives (model: HUH721212ALN604). We had previously tested these drives in Q3 with no failures, so we have filled a Backblaze Vault with 1,200 drives. After about one month we’ve only had one failure, so they are off to a good start.
- The HGST drives have a ways to go as in Q4 we also added 6,045 Seagate 12 TB drives (model: ST12000NM0007) to bring us to 31,146 of this drive model. That’s 29.7% of our drive farm.
- Finally in Q4, we added 1,200 Toshiba 14 TB drives (model: MG07ACA14TA). These are helium-filled PMR (perpendicular magnetic recording) drives. The initial annualized failure rate (AFR) is just over 3%, which is similar to the other new models and we would expect the AFR to drop over time as the drives settle in.
Comparing Hard Drive Failure Rates Over Time
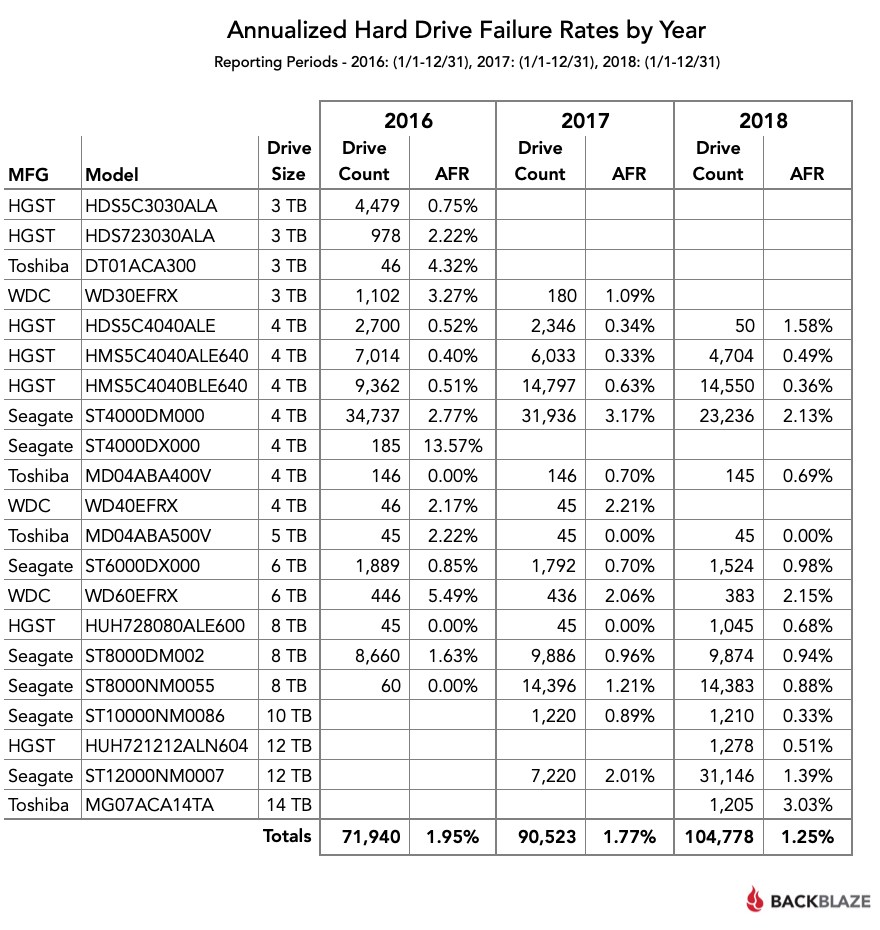
When we compare Hard Drive stats for 2018 to previous years two things jump out. First, the migration to larger drives, and second, the improvement in the overall annual failure rate each year. The chart below compares each of the last three years. The data for each year is inclusive of that year only.
Notes and Observations
- In 2016 the average size of hard drives in use was 4.5 TB. By 2018 the average size had grown to 7.7 TB.
- The 2018 annualized failure rate of 1.25% was the lowest by far of any year we’ve recorded.
- None of the 45 Toshiba 5 TB drives (model: MD04ABA500V) has failed since Q2 2016. While the drive count is small, that’s still a pretty good run.
- The Seagate 10 TB drives (model: ST10000NM0086) continue to impress as their AFR for 2018 was just 0.33%. That’s based on 1,220 drives and nearly 500,000 drive days, making the AFR pretty solid.
Lifetime Hard Drive Stats
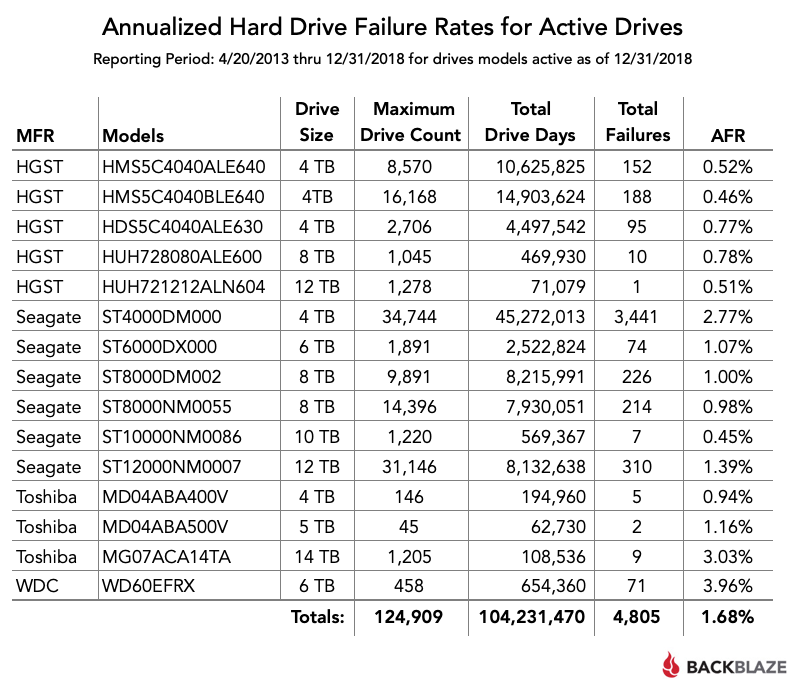
While comparing the annual failure rates of hard drives over multiple years is a great way to spot trends, we also look at the lifetime annualized failure rates of our hard drives. The chart below is the annualized failure rates of all of the drives currently in production.
Hard Drive Stats Webinar
We’ll be presenting the webinar “Backblaze Hard Drive Stats for 2018” on Thursday, January 24, 2019 at 10:00 Pacific time. The webinar will dig deeper into the quarterly, yearly, and lifetime hard drive stats and include the annual and lifetime stats by drive size and manufacturer. You will need to subscribe to the Backblaze BrightTALK channel to view the webinar. Sign up today.
The Hard Drive Stats Data
The complete data set used to create the information used in this review is available on our Hard Drive Test Data page. You can download and use this data for free for your own purpose. All we ask are three things: 1) you cite Backblaze as the source if you use the data, 2) you accept that you are solely responsible for how you use the data, and 3) you do not sell this data to anyone; it is free.
If you just want the summarized data used to create the tables and charts in this blog post you can download the ZIP file containing the CSV file.
Good luck and let us know if you find anything interesting.