In our last report for Q2 2016, we counted 68,813 spinning hard drives in operation. For Q3 2016 we have 67,642 drives, or 1,171 fewer hard drives. Stop, put down that Twitter account, Backblaze is not shrinking. In fact, we’re growing very nicely and are approaching 300PB of data under our management. We have fewer drives because over the last quarter we swapped out more than 3,500 2TB HGST and WDC hard drives for 2,400 8TB Seagate drives. So we have fewer drives, but more data. Lots more data! We’ll get into the specifics a little later on, but first, let’s take a look at our Q3 2016 drive stats.
Backblaze Hard Drive Reliability Stats for Q3 2016
Below is the hard drive failure data for Q3 2016. This chart is just for the period of Q3 2016. The hard drive models listed below are data drives, not boot drives. We only list drive models that have 45 or more of that model deployed.
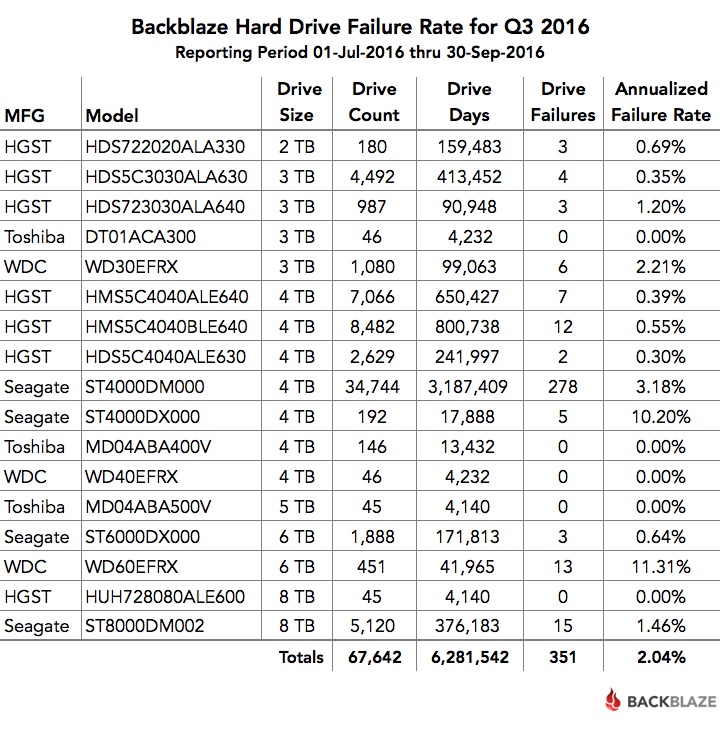
A couple of comments on the chart:
- The models that have an annualized failure rate of 0.00% had zero hard drive failures in Q3 2016.
- The annualized failure rate is computed as follows: ((Failures)/(Drive Days/365)) * 100. Therefore, consider the number of failures and drive days before reaching any conclusions about the failure rate.
Less Is More: The Move to 8TB Drives
In our Q2 2016 drive stats post, we covered the beginning of our process to migrate the data on our aging 2TB hard drives to new 8TB hard drives. At the end of Q2, the migration was still in process. All of the 2TB drives were still in operation, along with 2,720 of the new 8TB drives—the migration target. In early Q3, that stage of the migration project was completed and the “empty” 2TB hard drives were removed from service.
We then kicked off a second wave of migrations. This wave was smaller but continued the process of moving data from the remaining 2TB hard drives to the 8TB based systems. As each migration finished, we decommissioned the 2TB drives and they stopped reporting daily drive stats. By the end of Q3, we had only 180 of the 2TB drives left—four Storage Pods with 45 drives each.
The following table summarizes the shift over the second and third quarters.
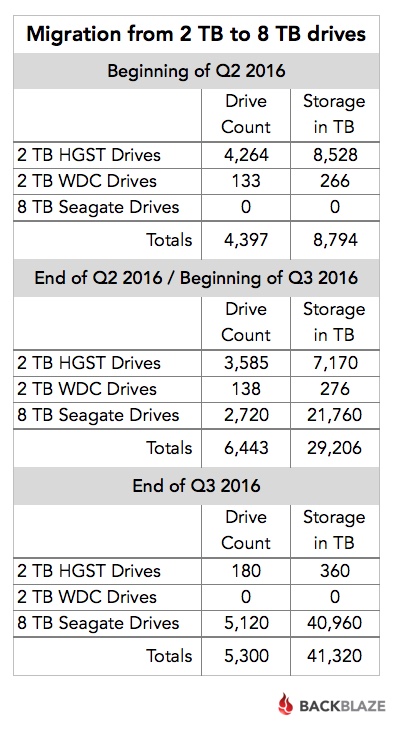
As you can see, during Q3 we “lost” over 1,100 hard drives from Q2, but we gained about 12PB of storage. Over the entire migration project (Q2 and Q3), we added about 900 total drives while gaining 32PB of storage.
Drive Migration and Hard Drive Failure Rates
A fourfold storage density increase takes care of much of the math in justifying the migration project. Even after factoring drive cost, migration costs, drive recycling, electricity, and all the other incidentals, the migration still made economic sense. The only wildcard was the failure rates of the hard drives in question. Why? The 2TB HGST drives had performed very well. Drive failure is to be expected, but our costs go up if the new drives fail at twice or three times the rate of the 2TB drives. With that in mind, let’s take a look at the failure rates of the drives involved in the migration project.
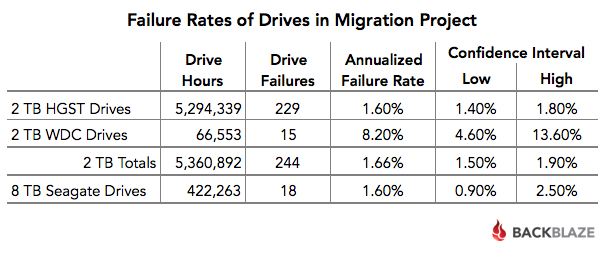
The Seagate 8TB drives are doing very well. Their annualized failure rate compares favorably to the HGST 2TB hard drives. With the average age of the HGST drives being 66 months, their failure rate was likely to rise, simply because of normal wear and tear. The average age of the Seagate 8TB hard drives is just three months, but their 1.6% failure rate during the first few months bodes well for a continued low failure rate going forward.
What About the 60 Drive Storage Pods?
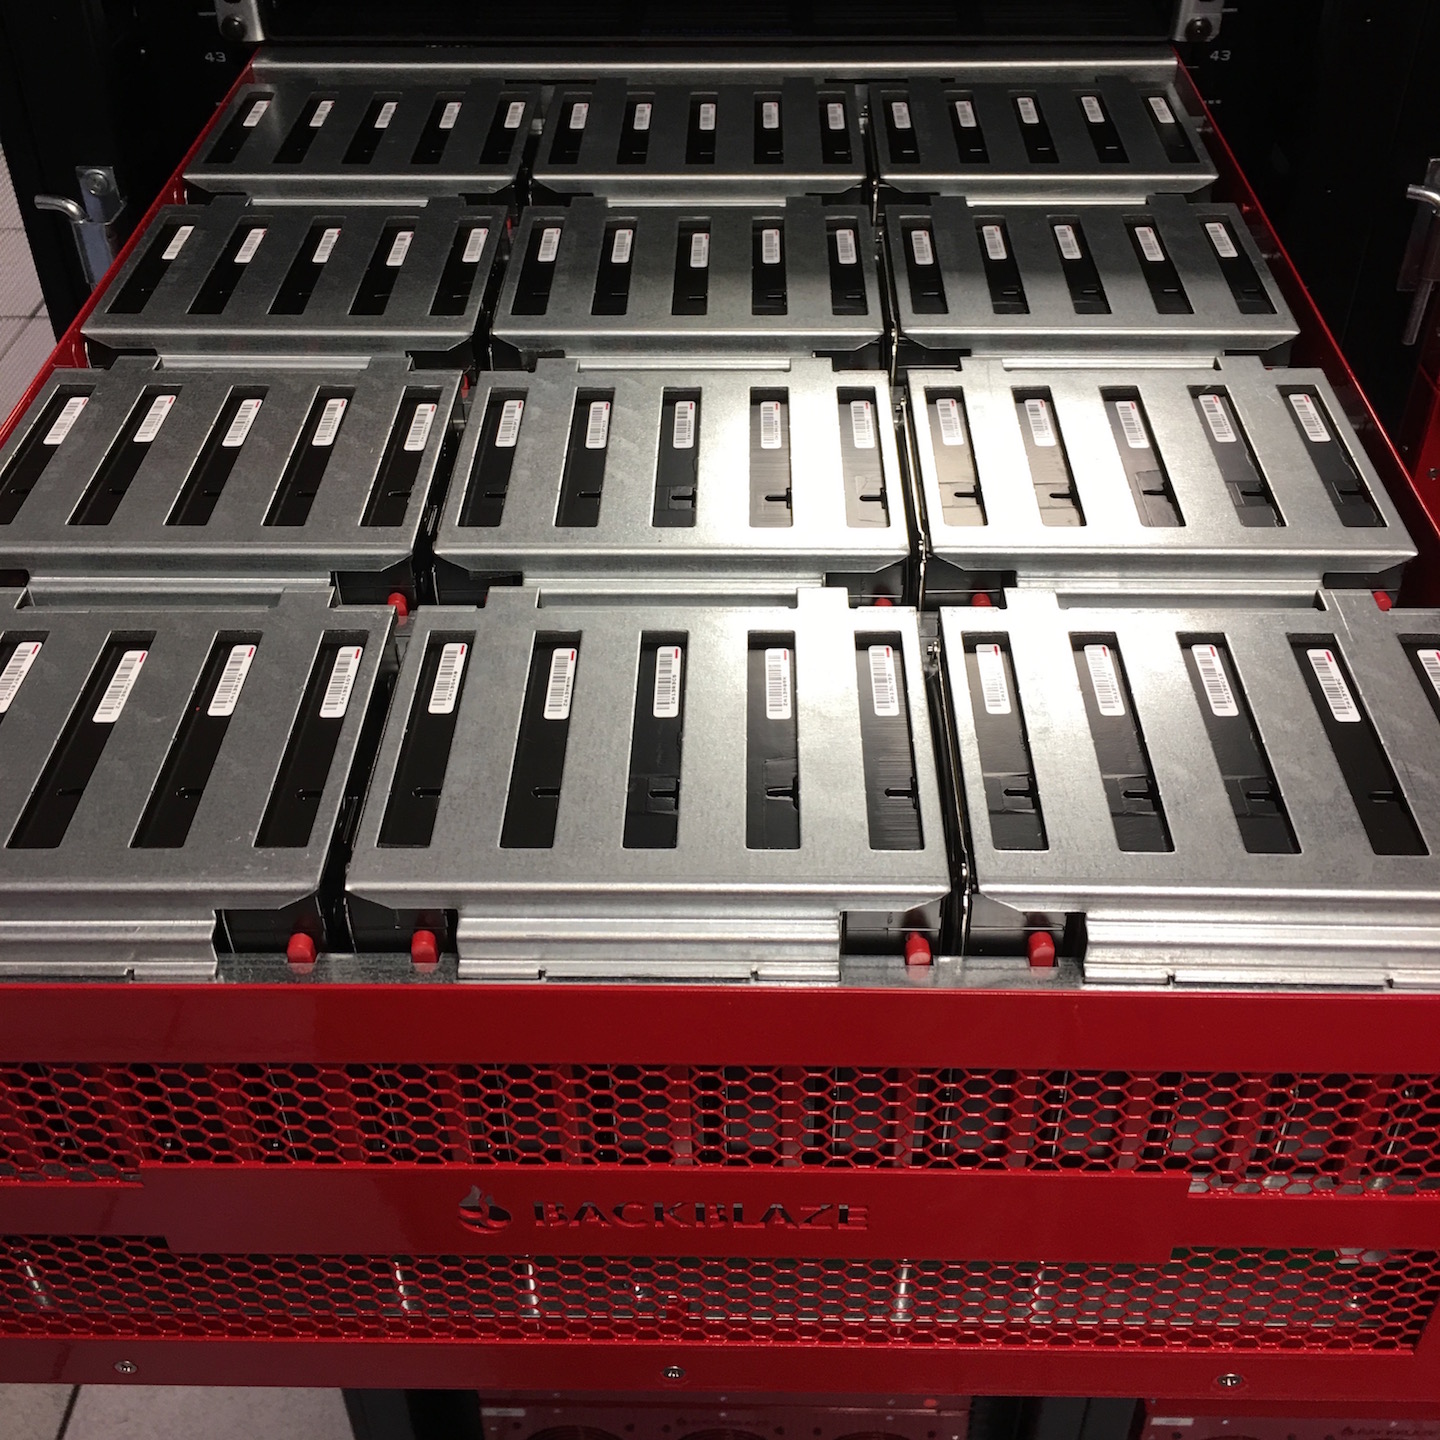
In Q3 we deployed 2,400 8TB drives into two Backblaze Vaults. We used 60 drive Storage Pods in each vault. In other words, each Backblaze Vault had 1,200 hard drives and each hard drive was 8TB. That’s 9.6PB of storage in one Backblaze Vault.
Each Backblaze Vault has 9.6PB of storage.
As a reminder, each Backblaze Vault consists of 20 Storage Pods logically grouped together to act as one storage system. Storage Pods are spread out across a data center in different cabinets, on different circuits and on different network switches to maximize data durability. Backblaze Vaults are the backbone that powers both our cloud backup and Backblaze B2 Cloud Storage services.
Our Q3 switch to 60 drive Storage Pods signals the end of the line for our 45 drive systems. They’ve had a good long run. We put together the history of our Storage Pods for anyone who is interested. Over the next couple of years, all of our 45 drive Storage Pods will be replaced by 60 drive systems. Most likely this will be done as we migrate from 3TB and 4TB drives to larger hard drives. I hear 60TB HAMR drives are just around the corner, although we might have to wait for the price to drop a bit.
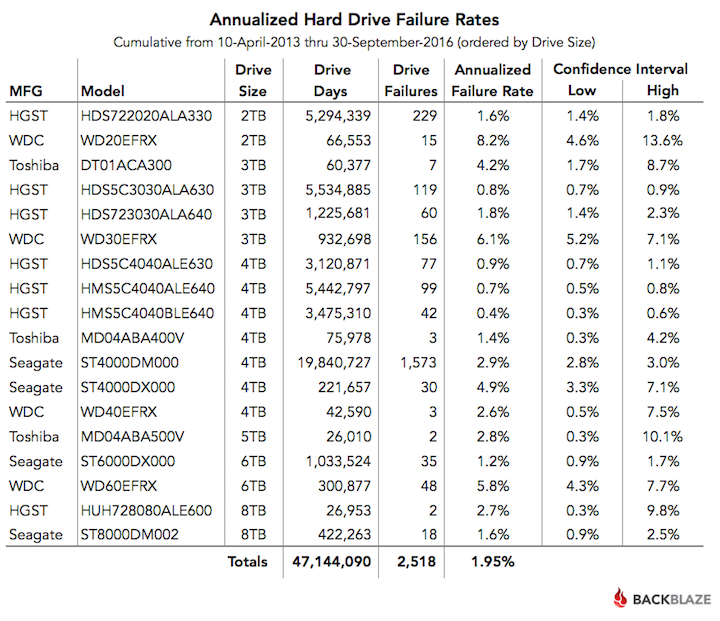
Cumulative Hard Drive Failure Rates by Model
Regardless of the drive size or the Storage Pod used, we’ll continue to track and publish our data on our Hard Drive Test Data webpage. If you’re not into wading through several million rows of hard drive data, the table below shows the annualized drive failure rate over the lifetime of each of the data drive models we currently have under management. This is based on data from April 2013 through September 2016 for all data drive models with active drives as of September 30, 2016.
Hard Drive Stats Webinar: Join Us!
Want more details on our Q3 drive stats? View the webinar below in the Backblaze BrightTALK channel. You will need to subscribe to the Backblaze channel to view the webinar, but you’ll only have to do that once.
Recap
Less is more! The migrations are finished for the moment, although we are evaluating the migration from 3TB drives to 10TB drives. First though, we’d like to give our data center team a chance to catch their breath. The early returns on the Seagate 8TB drives look good. The 1.6% failure rate at the 3 month point is the best we’ve seen from any Seagate drive we’ve used at the same average age. We’ll continue to track this going forward.
Next time, we’ll cover our Q4 drive stats, along with a recap of the lifetime performance of every data drive we’ve used past and present. That should be fun.
Looking for the tables, charts, and images from this post? You can download them from Backblaze B2 as a ZIP file (2.3MB).