
Welcome to the first Drive Stats of 2025. In case you missed it, the 2024 Drive Stats report was the last for long-time Drive Stats guru, Andy Klein, who is happily retired—off putting the “green” in greener pastures by working on his golf game. We–being Backblaze staff writer Stephanie Doyle and Chief Technical Evangelist Pat Patterson–are picking up where Andy left off, bringing you the metrics and analysis you know and love. Now, on to the numbers!
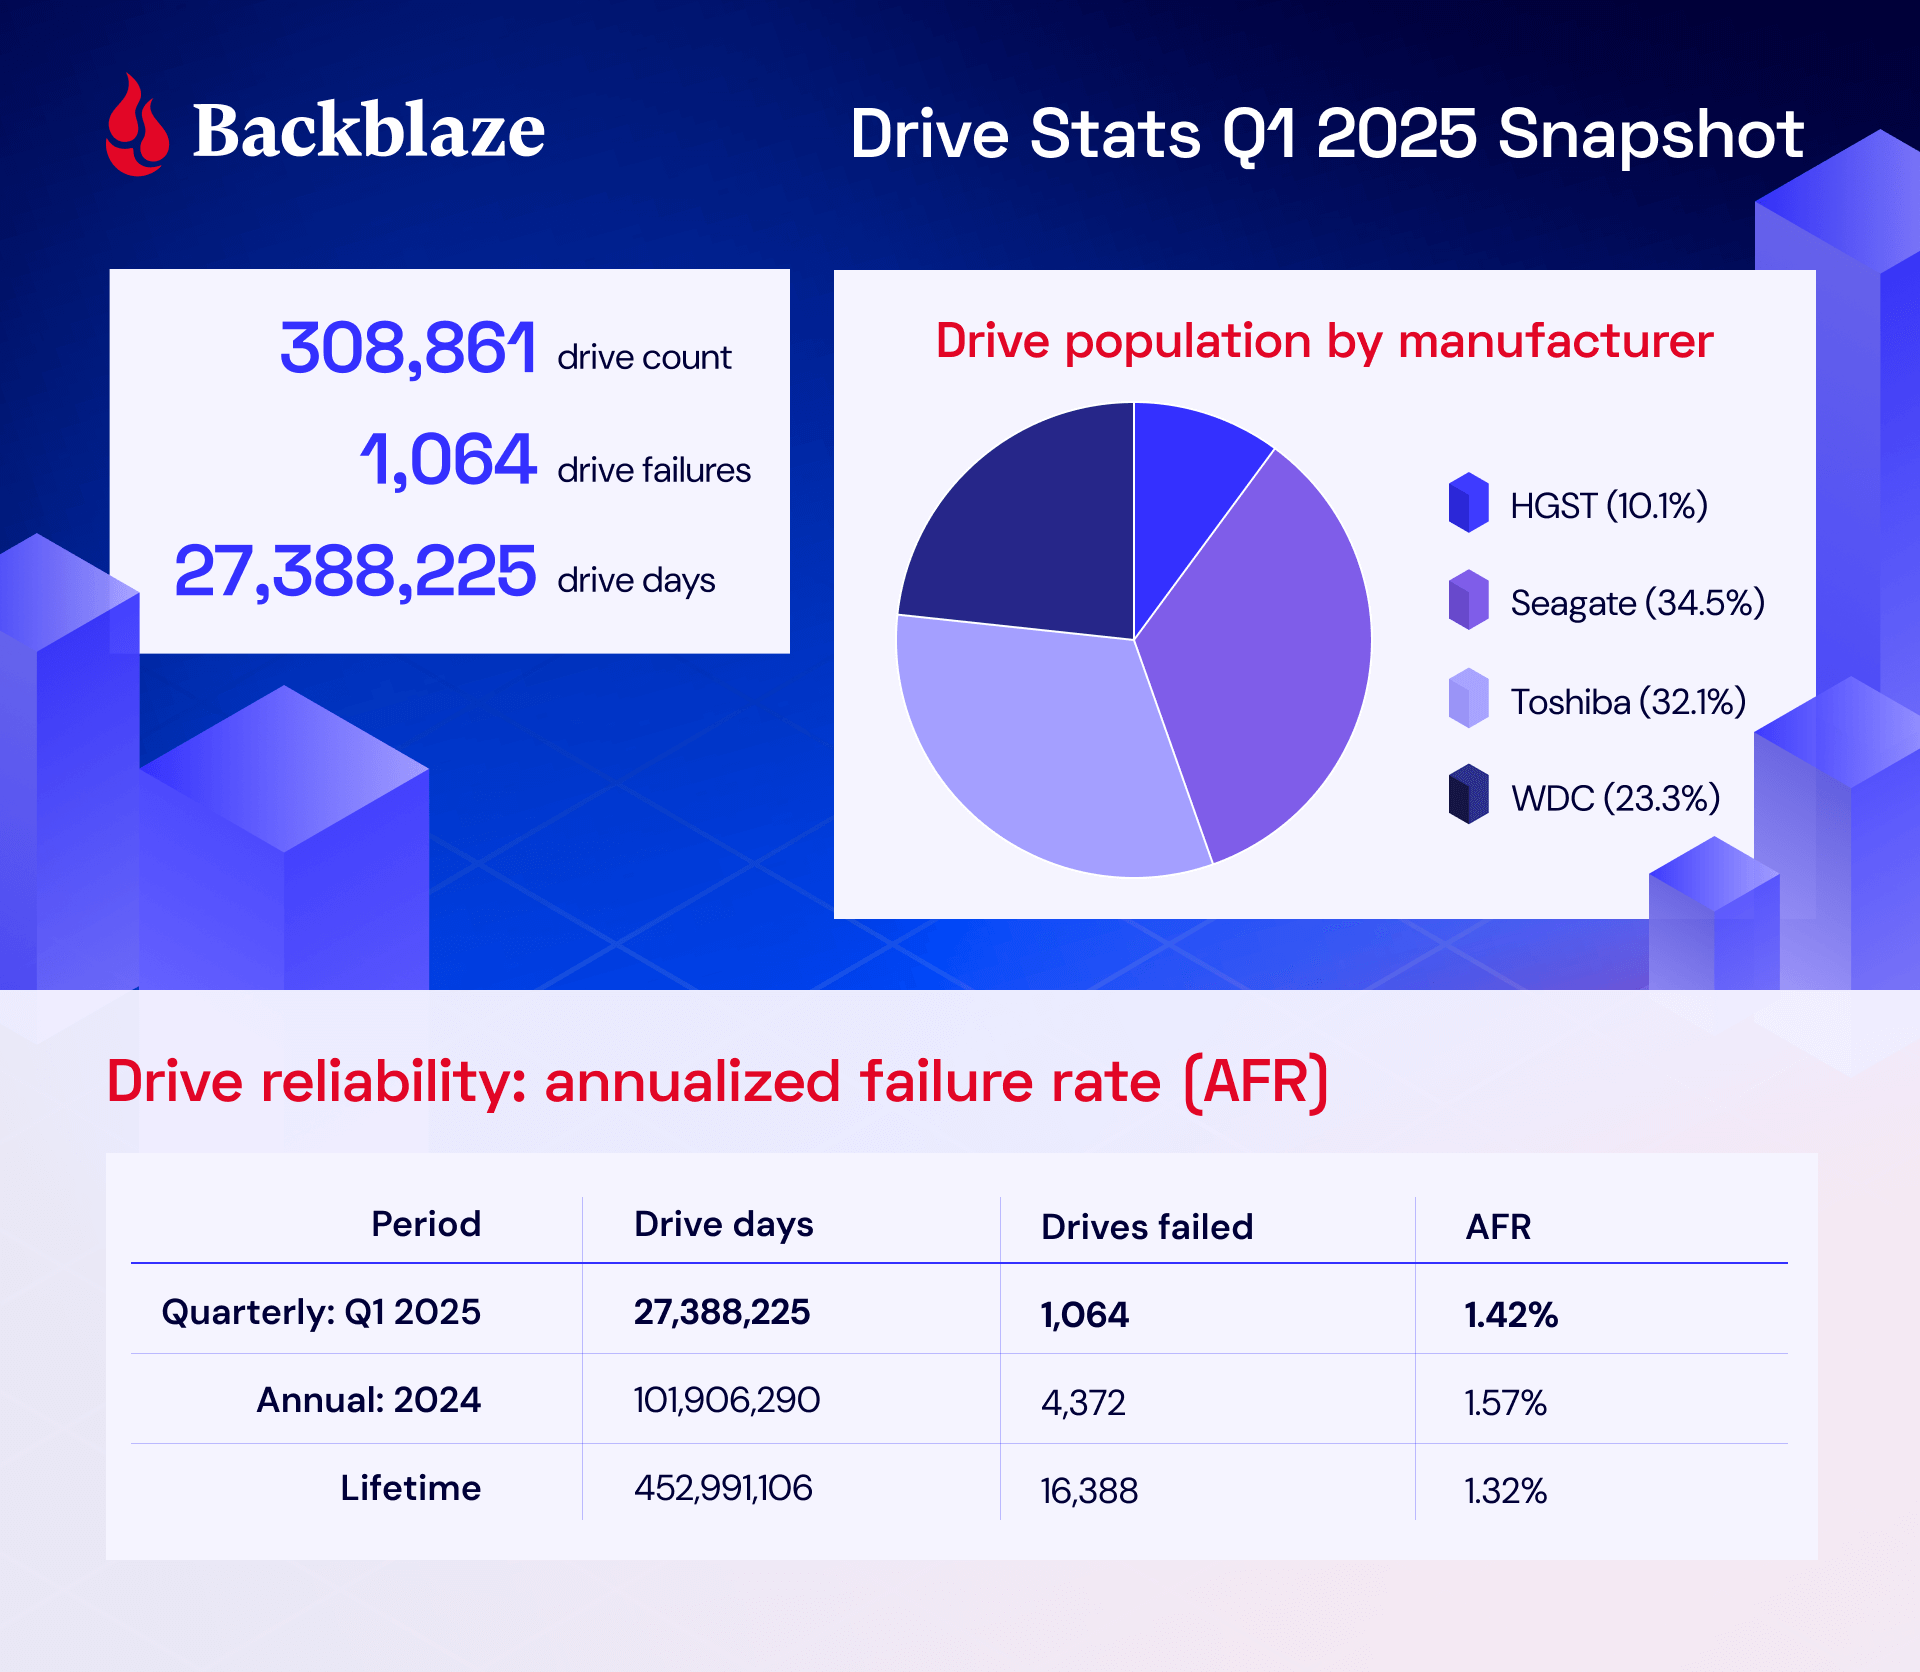
As of March 31, 2025, we had 312,831 drives under management. Of that total, there were 3,970 boot drives and 308,861 data drives. We’ll review their annualized failure rates (AFRs) as of Q1 2025, and we’ll dig into the average age of drive failure by model, drive size, and more. Along the way, we’ll share our observations and insights on the data presented and, this time around, we’ve got some exciting updates to share about how we produce Drive Stats. (Stay tuned, fellow Snowflake fans.)
As always, we look forward to your thoughts—we’ll see you in the comments section.
Sign up for the Drive Stats LinkedIn Live
Ready to dive deeper into the data? Tune in Thursday, May 15, 2025 at 10:00 a.m. PT, to query the new Drive Stats team, Stephanie Doyle and Pat Patterson. Feel free to drop us a line with any questions you want us to answer.
Drive Stats by the numbers: The digest version
Q1 2025 hard drive failure rates
As mentioned above, at the end of Q1 2025, we were running 312,831 drives. During the quarter as a whole, however, we were monitoring a total of 318,426 drives; this count includes those that were taken out of service during the quarter, either because they failed or were only used temporarily.
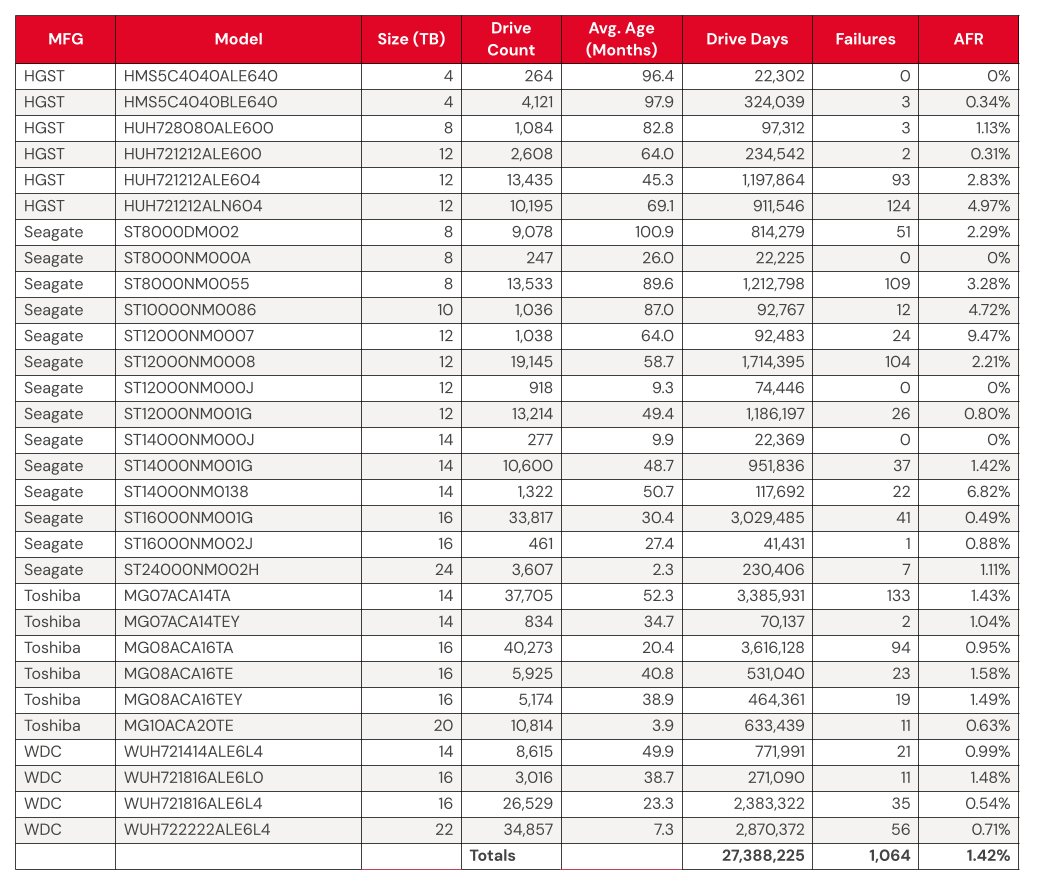
We’ll discuss the criteria we used in the next section of this report. Removing these drives leaves us with 317,833 hard drives to analyze. The table below shows the annualized failure rates (AFR) for Q1 2025 for this collection of drives.
Backblaze Hard Drive Failure Rates for Q1 2025
Reporting period January 1, 2025–March 31, 2025 inclusive
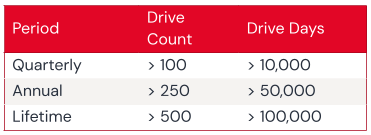
Drive models with drive count > 100 as of March 31, 2025 and drive days > 10,000 in Q1 2025.
Notes and observations
- The 4TB drives are hanging on and finishing strong. Good news: We have another quarter’s worth of data on our beloved 4TB drives (though the planned migration is well underway). True to their history, the 4TB drives showed wonderfully low failure rates, with yet another quarter of zero failures from model HMS5C4040ALE640 and 0.34% AFR from model HMS5C4040BLE640.
- Keeping an eye on the 20TB+ pool. The 24TB Seagate (model ST24000NM002H) no longer has a perfect record, with eight failures for the quarter. Still, the drives put up a respectable 1.11% AFR. Meanwhile, the 20TB+ drives as a pool are averaging a 0.72% AFR, coming in lower than the overall failure rates—always a promising sign.
- Zero failures for the quarter. Four drives get a gold star for zero failures this quarter:
- The 4TB HGST (model HMS5C4040ALE640)
- The Seagate 8TB (model ST8000NM000A)
- Seagate 12TB (model ST12000NM000J)
- Seagate 14TB (model ST14000NM000J)
Three out of the four also had zero failures last quarter, all but the Seagate 12TB.
- The quarterly failure rate is slightly higher. The quarterly failure rate went up from 1.35% to 1.42%. As with the zero-failure club, our higher-end outlier AFRs show some of the usual suspects:
- Seagate 10TB (model ST10000NM0086). Q4 2024: 5.72%. Q1 2025: 4.72%.
- HGST 12TB (model HUH721212ALN604). Q4 2024: 5.15%. Q1 2025: 4.97%.
- Seagate 12TB (model ST12000NM0007). Q4 2024: 8.72%. Q1 2025: 9.47%.
- Seagate 14TB (model ST14000NM0138). Q4 2024: 5.95%. Q1 2025: 6.82%.
Drive model criteria
We noted earlier we removed 593 drives from consideration when we produced the table above covering Q4 2024. There are two primary reasons we did not consider these drive models.
- Testing. These are drives of a given model that we monitor and collect Drive Stats data on, but are not considered production drives at this time. For example, drives undergoing certification testing to determine if they are performant enough for our environment are not included in our Drive Stats calculations.
- Insufficient data points. When we calculate the annualized failure rate for a drive model for a given period of time (quarterly, annual, or lifetime), we want to ensure we have enough data to reliably do so. Therefore we have defined criteria for a drive model to be included in the tables and charts for the specified period of time. Models that do not meet these criteria are not included in the tables and charts for the period in question.
Regardless of whether or not a given drive model is included in the charts and tables, all of the data for all of the drives we use is included in our Drive Stats dataset which you can download by visiting our Drive Stats page.
As with the Q4 quarterly results, we will apply these criteria to the annual and lifetime charts that follow in this report.
Lifetime hard drive failure rates
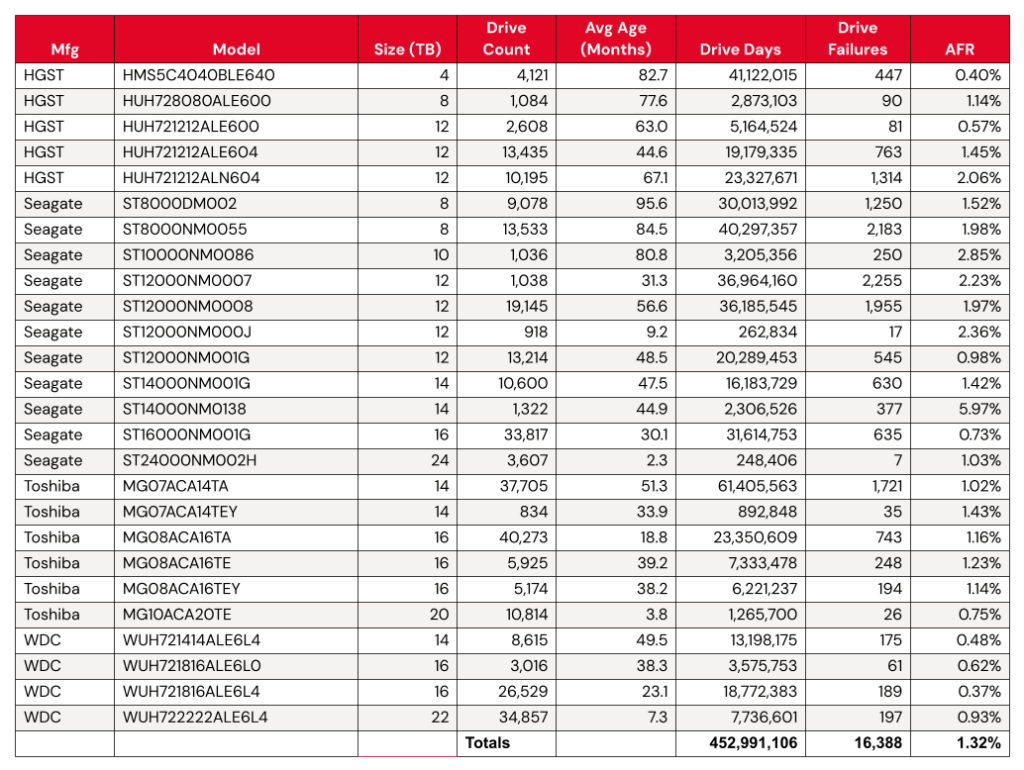
As of the end of Q1 2025, we were tracking 312,831 data hard drives. To be considered for the lifetime review, a drive model was required to have 500 or more drives as of the end of Q1 2025 and have over 100,000 accumulated drive days during their lifetime. When we removed those drive models which did not meet the lifetime criteria, we had 312,493 drives grouped into 26 models remaining for analysis as shown in the table below.
Backblaze Lifetime Hard Drive Failure Rates
Reporting period ending March 31, 2025 inclusive
Drive models with > 500 drives and > 100,000 lifetime drive days
Notes and observations
The lifetime AFR remains steady, despite some drives having significant change. We see virtually no change in our overall lifetime AFR, which we last tracked at 1.31% in the 2024 Year-End Drive Stats Report. But, with some drive models showing significant change in year-over-year AFR, it’s worth digging in a little deeper.
Statistically significant improved AFRs:
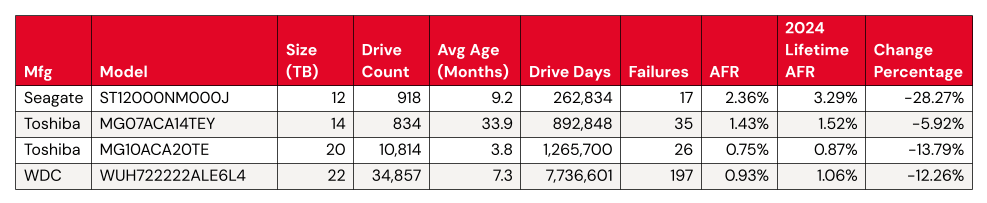
- Both the 12TB and the 14TB had the same number of failures (or nearly so). Meanwhile, the Toshiba 20TB and WDC 22TB had more failures, but added a significant number of drives to the fleet. Both of these activities increase the number of drive days we tracked for the model’s drive pool, so these results are unsurprising.
Statistically significant worsened AFRs:
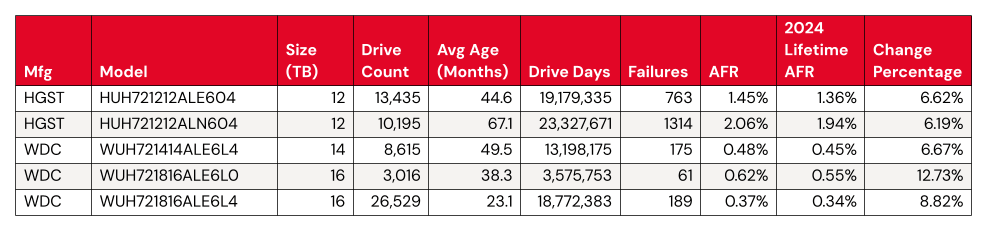
- Meanwhile, we have a few things happening for the significantly worsened AFRs. The WDC drive models are all top performers from a failure perspective, even a change from 0.45% to 0.48% shows up in the numbers.
- That leaves us with two HGST 12TB drives. Both come in above the average failure rate, at 1.45% (model: HUH721212ALE604) and 2.06% (model: HUH721212ALN604). We can give HUH721212ALE604 a pass—with the drive pool showing an average age of 67.1 months, or about five and a half years, it’s firmly on track with the expected pattern defined by the bathtub curve.
- Where does that leave us with model HUH721212ALE604? We’ll keep an eye on it. Given that its AFR rate isn’t too far off from the total AFR of the Backblaze drive fleet, it’s not hugely concerning unless we see the rate of change continue.
What’s new with Drive Stats?
In taking on this report, our main focus was to ensure continuity with our decades-old dataset. That said, we also saw some opportunities to streamline the process of data collection, a continuation of the work that David Winings talked about in Overload to Overhaul: How We Upgraded the Drive Stats Data and Drive Stats Data Deep Dive: The Architecture. All of these things set us up for not just an easier time generating this report, but some bigger plans in the future. (We won’t tip our hand yet—but stay tuned.)
Drive Stats gets a Snowflake upgrade
When we first started tracking Drive Stats way back in 2013, data collection was very ad hoc. For the first few years, when Brian Beach was at the helm, we published stats once a year. When Andy took over in 2015, he moved to publishing quarterly data (starting in 2016). As the dataset grew, and Andy’s collection of lightweight desktop apps started to run out of steam, it became apparent that we needed to upgrade to more capable analytical tooling. For a variety of operational reasons, Andy was gamely running SQL queries against CSV data imported into a MySQL instance running on his laptop—and having to do a ton of manual data cleanup to boot. (Pun obviously intended.)
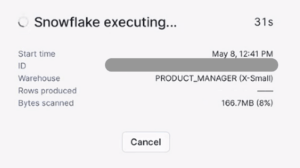
This year, with the help of our colleagues on the database engineering team (shoutout to Tom Roden—thanks so much!), we were able to get the Drive Stats data included in the Backblaze Snowflake instance. Gone are the days of us bugging folks for exports that take hours to process! We can run lightweight queries against a cached, structured table.
We started from Andy’s SQL queries and tweaked them a bit to match the logic and nomenclature of Snowflake fields. Once we had that worked out, the first thing we did was validate our methodology by running the Q4 Drive Stats numbers and comparing them to Andy’s—success.
It helps that Pat has experimented with our Drive Stats dataset in Trino and other analytical tools like Apache Iceberg, so it’s certainly not the first time he’s considered methodology and tooling for this problem. Going forward, we may further refine the process, but for now, the migration to Snowflake saved us a ton of time and manual data cleanup.
The Hard Drive Stats data
The complete dataset used to create the tables and charts in this report is available on our Hard Drive Test Data page. You can download and use this data for free for your own purpose. All we ask are three things: 1) you cite Backblaze as the source if you use the data, 2) you accept that you are solely responsible for how you use the data, and 3) you do not sell this data itself to anyone; it is free.
Good luck, and let us know if you find anything interesting.