Editor’s Note: Since 2013, Backblaze has published statistics and insights based on the hard drives in our data centers. Why? Well, we like to be helpful, and we thought sharing would help others who rely on hard drives, but don’t have reliable data on performance to make informed purchasing decisions. We also hoped the data might aid manufacturers in improving their products. Given the millions of people who’ve read our Hard Drive Stats posts and the increasingly collaborative relationships we have with manufacturers, it seems we might have been right.
But we don’t only share our take on the numbers, we also provide the raw data underlying our reports so that anyone who wants to can reproduce them or draw their own conclusions, and many have. We love it when people reframe our reports, question our logic (maybe even our sanity?), and provide their own take on what we should do next. That’s why we’re featuring Ryan Smith today.
Ryan has held a lot of different roles in tech, but lately he’s been dwelling in the world of storage as a product strategist for Hitachi. On a personal level, he explains that he has, “passion for data, finding insights from data, and helping others see how easy and rewarding it can be to look under the covers.” It shows.
A few months ago we happened on a post by Ryan with an appealing header featuring our logo with an EXPOSED stamp superimposed in red over our humble name. It looked like we had been caught in a sting operation. As a company that loves transparency, we were delighted. Reading on, we found a lot to love and plenty to argue over, but more than anything, we appreciated how Ryan took data we use to analyze hard drive failure rates and extrapolated out all sorts of other gleanings about our business. As he puts it, “it’s not the value at the surface but the story that can be told by tying data together.” So, we thought we’d share his original post with you to (hopefully) incite some more arguments and some more tying together of data.
While we think his conclusions are reasonable based on the data available to him, the views and analysis below are entirely Ryan’s. We appreciate how he flagged some areas of uncertainty, but thought it most interesting to share his thoughts without rebuttal. If you’re curious about how he reached them, you can find his notes on process here. He doesn’t have the full story, but we think he did amazing work with the public data.
Our 2019 Q3 Hard Drive Stats post will be out in a few weeks, and we hope some of you will take Ryan’s lead and do your own deep dive into the reporting when it’s public. For those of you who can’t wait, we’re hoping this will tide you over for a little while.
If you’re interested in taking a look at the data yourselves, here’s our Hard Drive Data and Stats webpage that has links to all our past Hard Drive Stats posts and zip files of the raw data.
Ryan Smith Uses Backblaze’s SMART Stats to Illustrate the Power of Data
(Originally published July 8, 2019 on Soothsawyer.com.)
It is now common practice for end-customers to share telemetry (call home) data with their vendors. My analysis below shares some insights about your business that vendors might gain from seemingly innocent data that you are sending them every day.
On a daily basis, Backblaze (a cloud backup and storage provider), logs all its drive health data (aka SMART data) for over 100,000 of its hard drives. With 100K+ records a day, each year can produce over 30 million records. They share this raw data on their website, but most people probably don’t really dig into it much. I decided to see what this data could tell me and what I found was fascinating.
Rather than looking at nearly 100 million records, I decided to only look at just over one million which consisted of the last day of every quarter from Q1’16 to Q1’19. This would give me enough granularity to see what is happening inside Backblaze’s cloud backup storage business. For those interested, I used MySQL to import and transform the data into something easy to work with (see more details on my SQL query); I then imported the data into Excel where I could easily pivot the data and look for insights. Below are the results of this effort.
Capacity Growth
User Data vs Physical Capacity
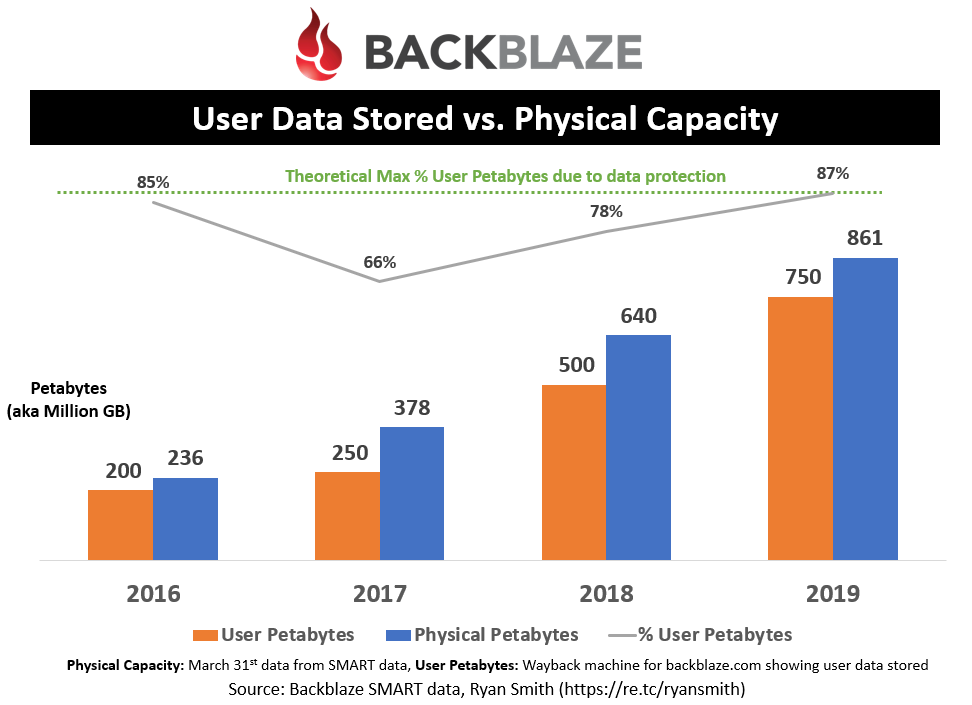
I grabbed the publicly posted “Petabytes stored” that BackBlaze claims on their website (“User Petabytes”) and compared that to the total capacity from the SMART data they log (“Physical Petabytes”) and then compared them against each other to see how much overhead or unused capacity they have. The Theoretical Max (green line) is based on their ECC protection scheme (13+2 and/or 17+3) that they use to protect user data. If the “% User Petabytes” is below that max then this means Backblaze either has unused capacity or they didn’t update their website with the actual data stored.
Data Read/Written vs Capacity Growth
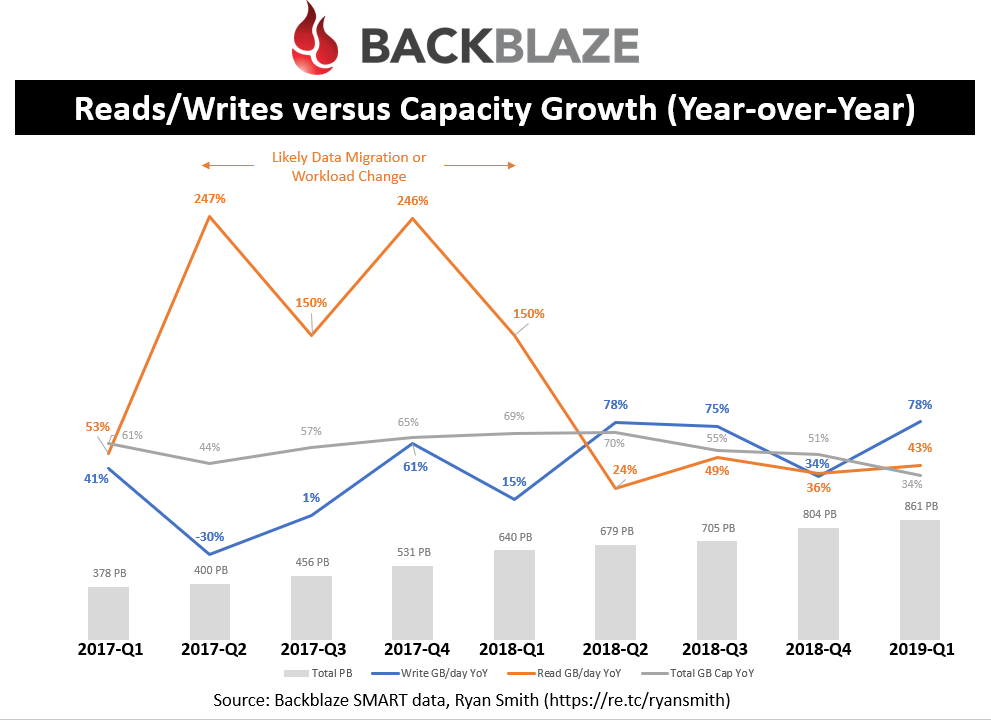
Looking at the last two years, by quarter, you can see a healthy amount of year-over-year growth in their write workload; roughly 80% over the last four quarters! This is good since writes likely correlate with new user data, which means broader adoption of their offering. For some reason their read workloads spiked in Q2’17 and have maintained a higher read workload since then (as indicated by the YoY spikes from Q2’17 to Q1’18, and then settling back to less than 50% YoY since); my guess is this was likely driven by a change to their internal workload rather than a migration because I didn’t see subsequent negative YoY reads.
Performance
Now let’s look at some performance insights. A quick note: Only Seagate hard drives track the needed information in their SMART data in order to get insights about performance. Fortunately, roughly 80% of Backblaze’s drive population (both capacity and units) are Seagate so it’s a large enough population to represent the overall drive population. Going forward, it does look like the new 12 TB WD HGST drive is starting to track bytes read/written.
Pod (Storage Enclosure) Performance
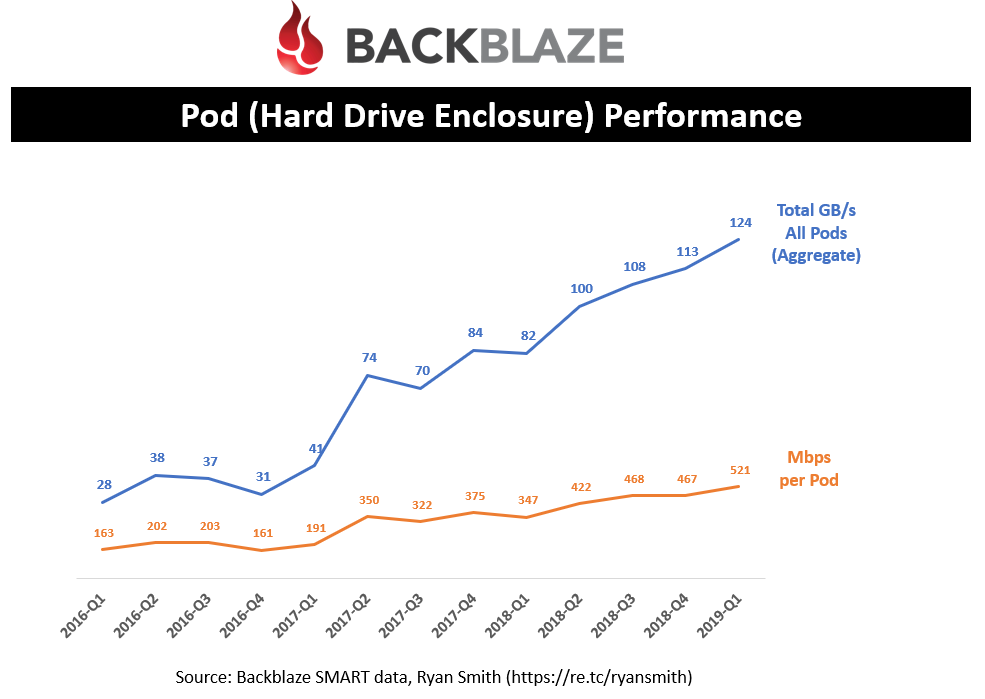
Looking at Power-on-hours of each drive, I was able to calculate the vintage of each drive and the number of drives in each “pod” (this is the terminology that Backblaze gives to its storage enclosures). This lets me calculate the number of pods that Backblaze has in its data centers. Their original pods stored 45 drives and this improved to 60 drives in ~Q2’16 (according to past blog posts by Backblaze). The power-on-date allowed me to place the drive into the appropriate enclosure type and provide you with pod statistics like the Mbps per pod. This is definitely an educated guess as some newer vintage drives are replacement drives into older enclosures but the overall percentage of drives that fail is low enough to where these figures should be pretty accurate.
Backblaze has stated that they can achieve up to 1 Gbps per pod, but as you can see they are only reaching an average throughput of 521 Mbps. I have to admit I was surprised to see such a low performance figure since I believe their storage servers are equipped with 10 Gbps ethernet.
Overall, Backblaze’s data centers are handling over 100 GB/s of throughput across all their pods, which is quite an impressive figure. This number keeps climbing and is a result of new pods as well as overall higher performance per pod. From quick research, this is across three different data centers (Sacramento x 2, Phoenix x 1) and maybe a fourth on its way in Europe.
Hard Drive Performance
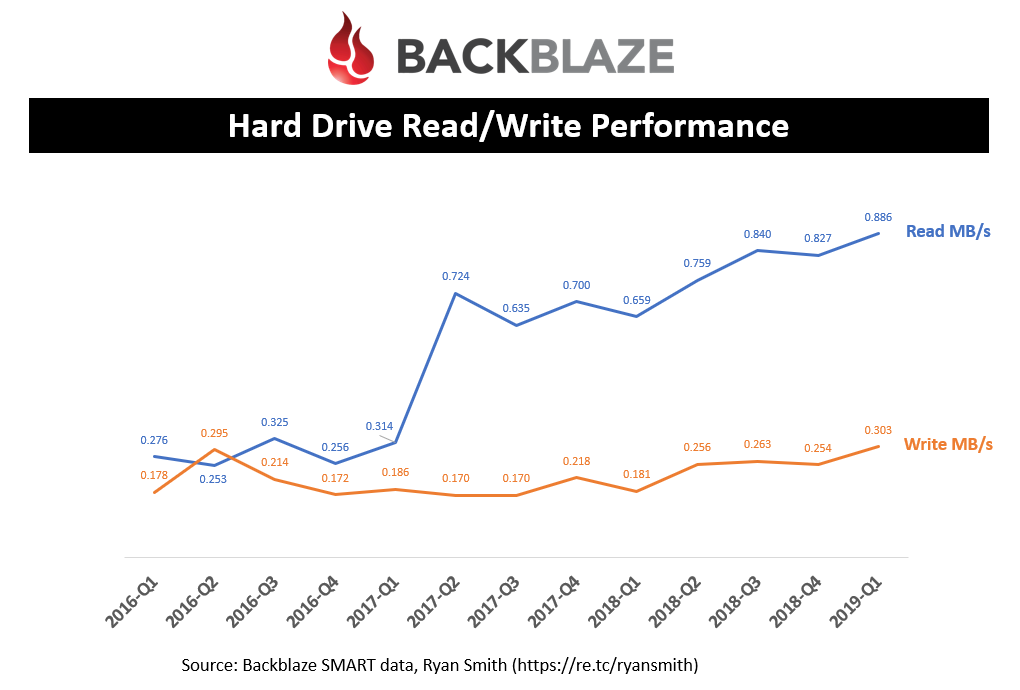
Since each pod holds between 45 and 60 drives, with an overall max pod performance of 1 Gbps, I wasn’t surprised to see such average low drive performance. You can see that Backblaze’s workload is read heavy with less than 1 MB/s and writes only a third of that. Just to put that in perspective, these drives can deliver over 100 MB/s, so Backblaze is not pushing the limits of these hard drives.
As discussed earlier, you can also see how the read workload changed significantly in Q2’17 and has not reverted back since.
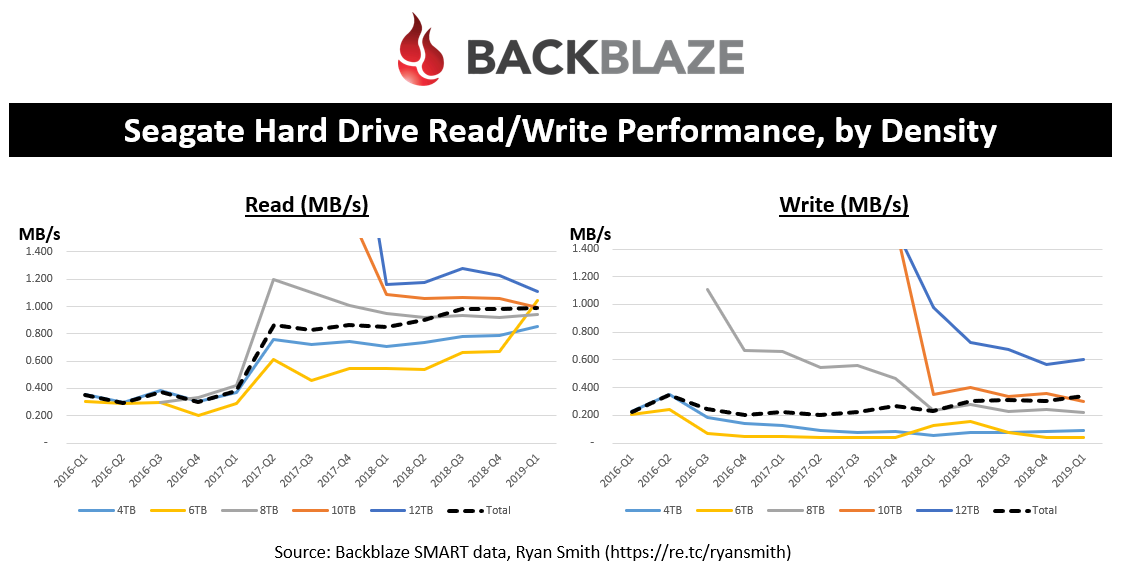
As I expected, the read and write performance is highly correlated to the drive capacity point. So, it appears that most of the growth in read/write performance per drive is really driven by the adoption of higher density drives. This is very typical of public storage-as-a-service (STaaS) offerings where it’s really about $/GB, IOPS/GB, MBs/GB, etc.
As a side note, the black dashed lines (average between all densities) should correlate with the previous chart showing overall read/write performance per drive.
Purchasing
Switching gears, let’s look at Backblaze’s purchasing history. This will help suppliers look at trends within Backblaze to predict future purchasing activities. I used power-on-hours to calculate when a drive entered the drive population.
Hard Drives Purchased by Density, by Year
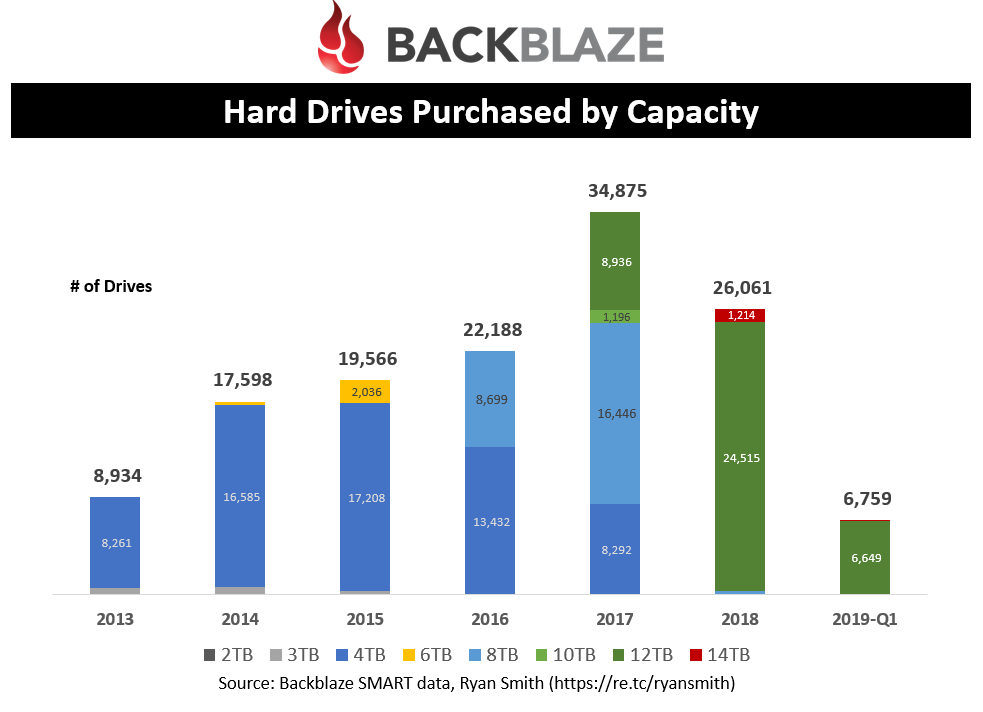
This chart helps you see how Backblaze normalized on 4 TB, 8 TB, and now 12 TB densities. The number of drives that Backblaze purchases every year has been climbing until 2018 where it saw its first decline in units. However, this is mainly due to the efficiencies of the capacity per drive.
A question to ponder: Did 2018 reach a point where capacity growth per HDD surpassed the actual demand required to maintain unit growth of HDDs? Or is this trend limited to Backblaze?
Petabytes Purchased by Quarter
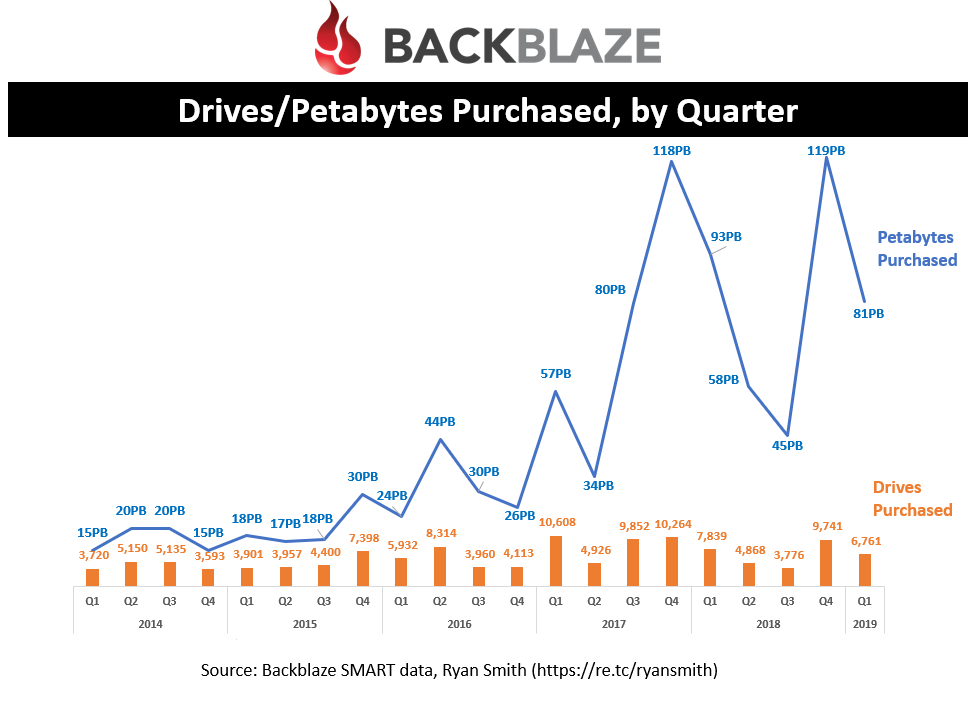
This looks at the number of drives purchased over the last five years, along with the amount of capacity added. It’s not quite regular enough to spot a trend, but you can quickly spot that the amount of capacity purchased over the last two years has grown dramatically compared to previous years.
HDD Vendor Market Share
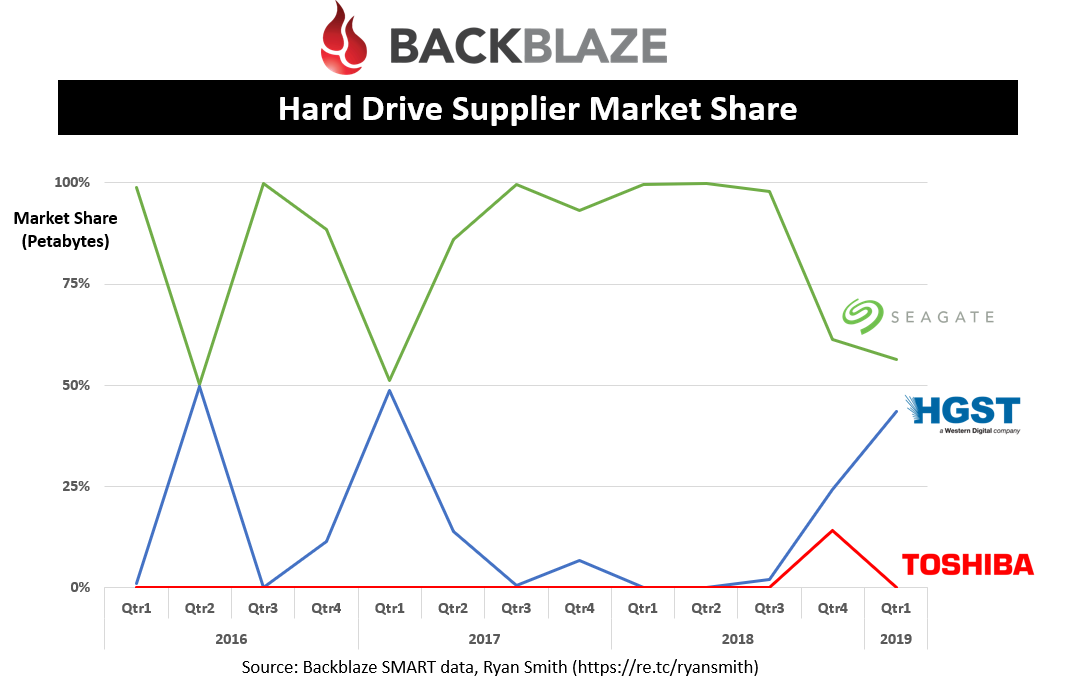
Western Digital/WDC, Toshiba/TOSYY, Seagate/STX
Seagate is definitely the preferred vendor, capturing almost 100% of the market share save for a few quarters where WD HGST wins 50% of the business. This information could be used by Seagate or its competitors to understand where it stands within the account for future bids. However, the industry is monopolistic so it’s not hard to guess who won the business if a given HDD vendor didn’t.
Drives
Drive Population by Quarter
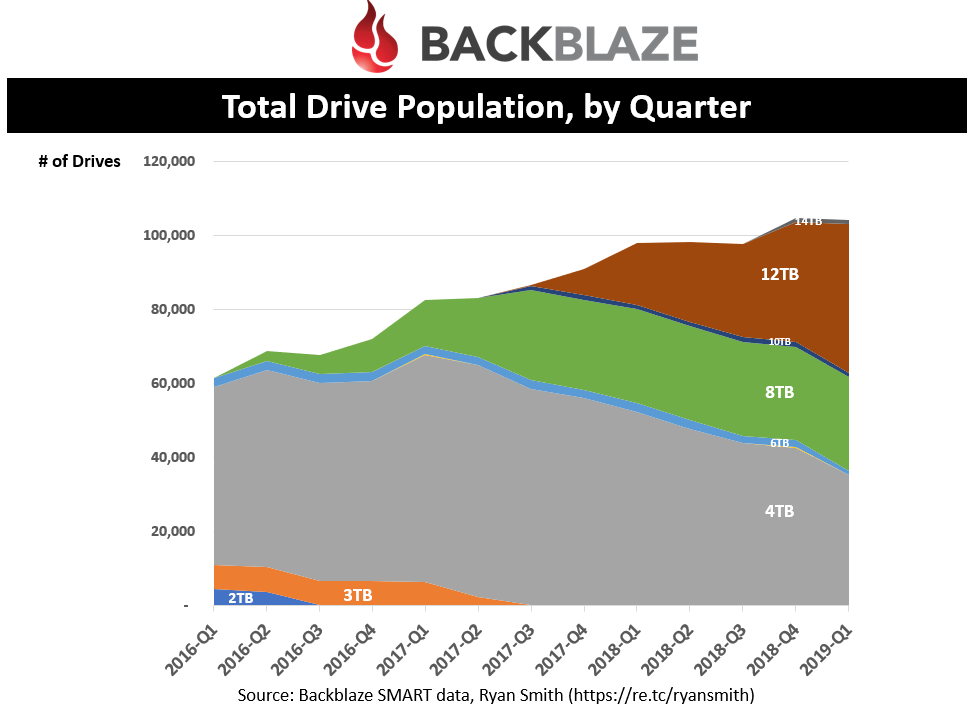
This shows the total drive population over the past three years. Even though the number of drives being purchased has been falling lately, the overall drive population is still growing.
You can quickly see that 4 TB drives saw its peak population in Q1’17 and has rapidly declined. In fact, let’s look at the same data but with a different type of chart.
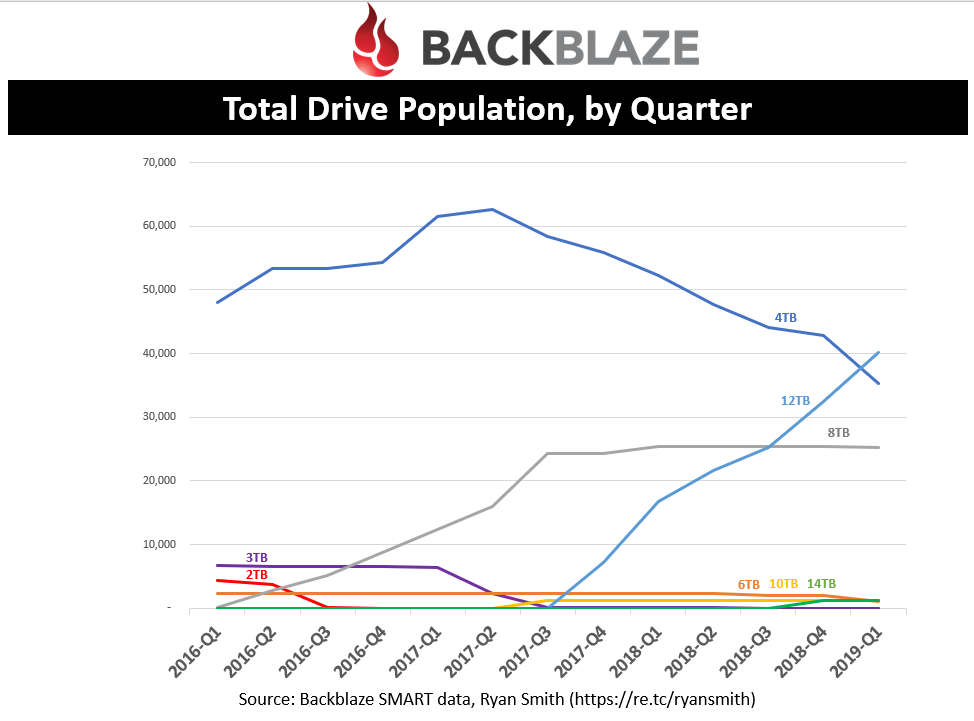
That’s better. We can see that 12 TBs really had a dramatic effect on both 4 TB and 8 TB adoption. In fact, Backblaze has been proactively retiring 4 TB drives. This is likely due to the desire to slow the growth of their data center footprint which comes with costs (more on this later).
As a drive vendor, I could use this data to use the 4 TB trend to calculate how much drive replacement will be occurring next quarter, along with natural PB growth. I will look more into Backblaze’s drive/pod retirement later.
Current Drive Population, by Deployed Date
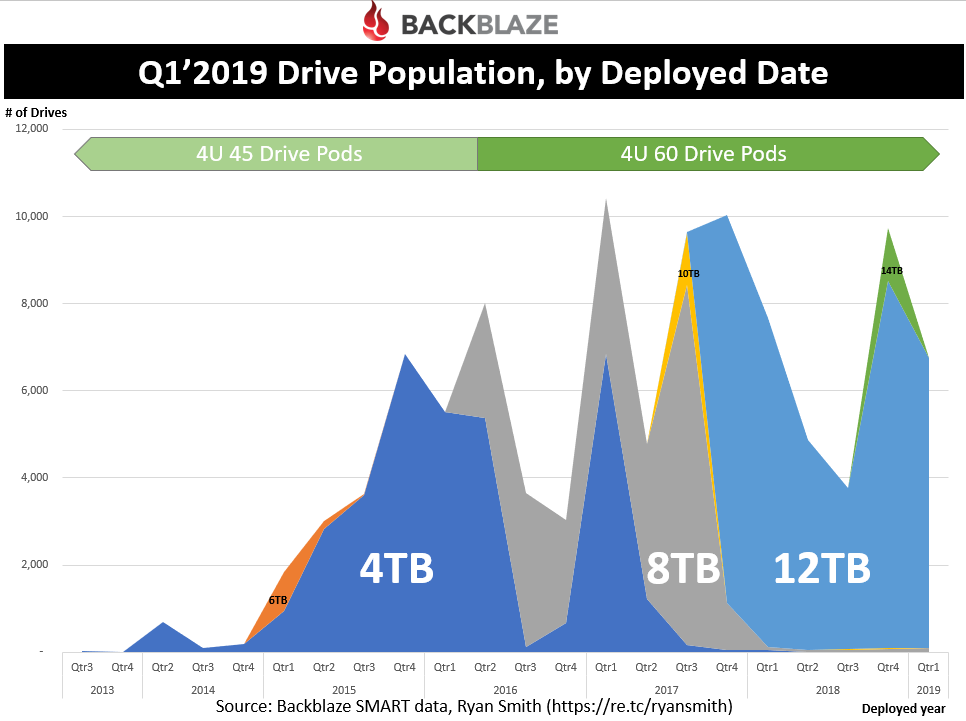
Be careful when interpreting this graph. What we are looking at here is the Q1’19 drive population where the date on the x-axis is the date the drive entered the population. This helps you see of all the drives in Backblaze’s population today, in which the oldest drives are from 2015 (with the exception of a few stragglers).
This indicates that the useful life of drives within Backblaze’s data centers are ~4 years. In fact, a later chart will look at how drives/pods are phased out, by year.
Along the top of the chart, I noted when the 60-drive pods started entering into the mix. The rack density is much more efficient with this design (rather than the 45-drive pod). Combine this with the efficiency of the 4 TB to 12 TB drives and it’s clear why Backblaze has aggressively been retiring its 4 TB/45-drive enclosures. There is still a large population of these remaining so expect some further migration to occur.
Boot Drive Population
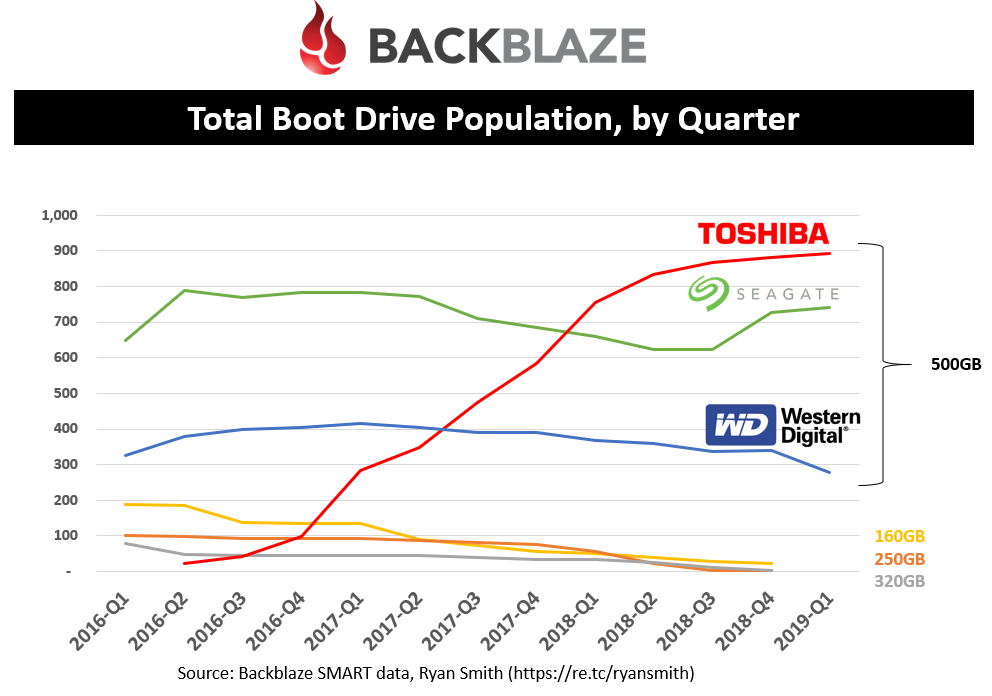
This is the overall boot drive population over time. You can see that it is currently dominated by the 500 GB with only a few remaining smaller densities in the population today. For some reason, Toshiba has been the preferred vendor with Seagate only recently gaining some new business.
The boot drive population is also an interesting data point to use for verifying the number of pods in the population. For example, there were 1,909 boot drives in Q1’19 and my calculation of pods based on the 45/60-drive pod mix was 1,905. I was able to use the total boot drives each quarter to double check my mix of pods.
Pods (Drive Enclosures)
As discussed earlier, pods are the drive enclosures that house all of Backblaze’s hard drives. Let’s take a look at a few more trends that show what’s going on within the walls of their data center.
Pods Population by Deployment Date
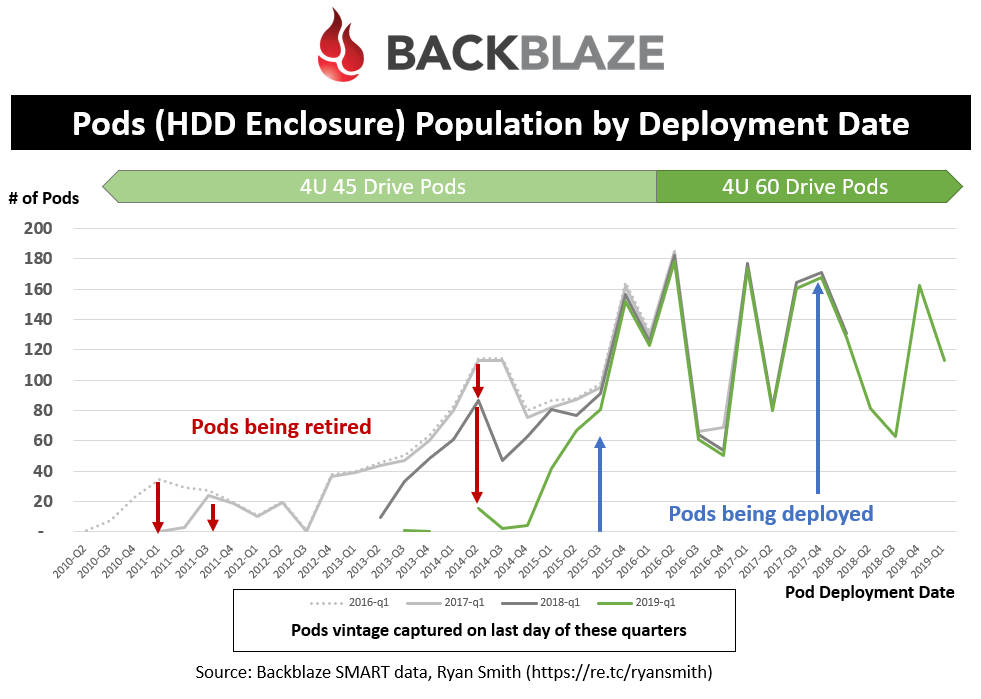
This one is interesting. Each line in the graph indicates a particular snapshot in time of the total population. And the x-axis represents the vintage of the pods for that snapshot. By comparing snapshots, this allows you to see changes over time to the population — namely, new pods being deployed and old pods being retired. To capture this, I looked at the last day of Q1 data for the last four years and calculated the date the drives entered the population. Using the “Power On Date” I was able to deduce the type of pod (45 or 60 drive) it was deployed in.
Some insights from this chart:
- From Q2’16 to Q1’17, they retired some pods from 2010-11
- From Q2’17 to Q1’18, they retired a significant number of pods from 2011-14
- From Q2’18 to Q1’19, they retired pods from 2013-2015
- Pods that were deployed since late 2015 have been untouched (you can tell this by seeing the lines overlap with each other)
- The most pods deployed in a quarter was 185 in Q2’16
- Since Q2’16, the number of pods deployed has been declining, on average; this is due to the increase in # of drives per pod and density of each drive
- There are still a significant number of 45-drive pods to retire
Pods Deployed/Retired
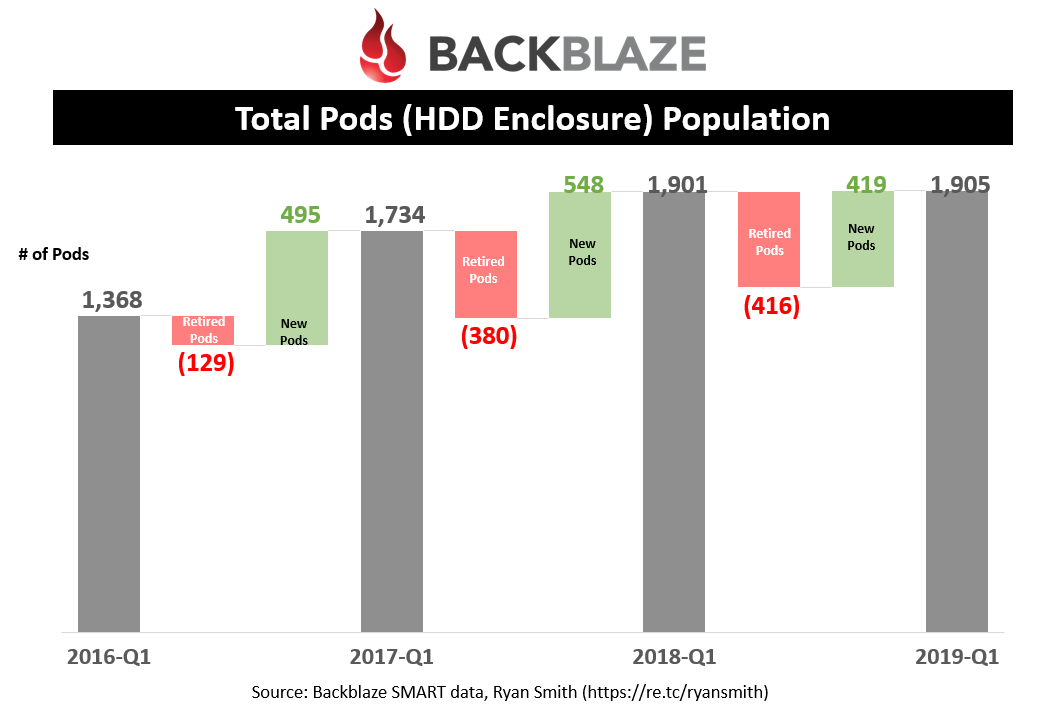
Totaling up all the new pods being deployed and retired, it is easier to see the yearly changes happening within Backblaze’s operation. Keep in mind that these are all calculations and may erroneously include drive replacements as new pods; but I don’t expect it to vary significantly from what is shown here.
The data shows that any new pods that have been deployed in the past few years have mainly been driven by replacing older, less dense pods. In fact, the pod population has plateaued at around 1,900 pods.
Total Racks
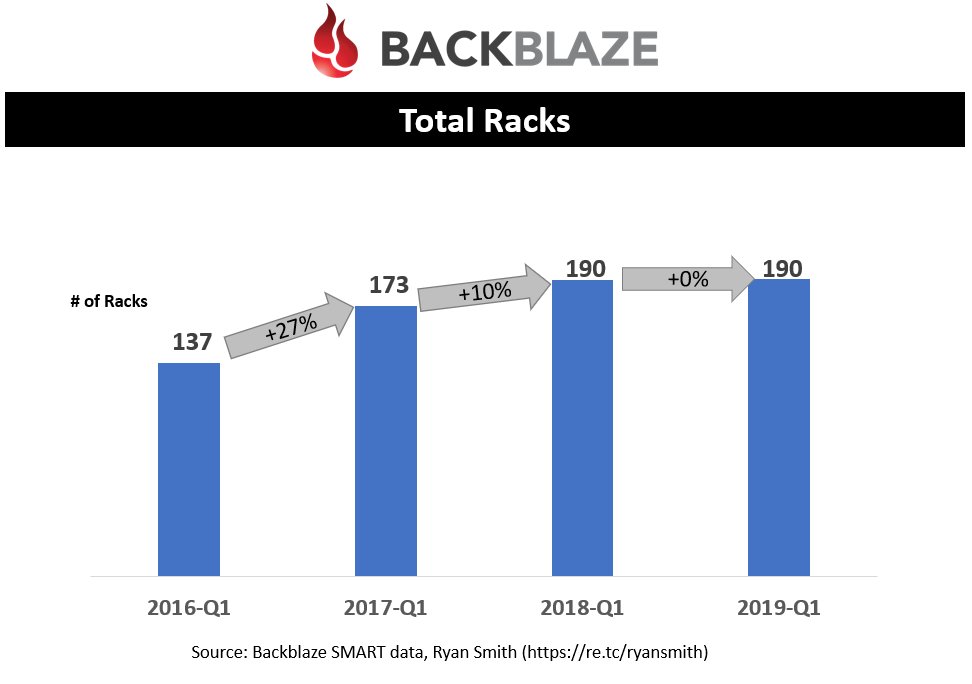
Based on blog posts, Backblaze’s pods are all designed at 4U (4 rack units) and pictures on their site indicate 10 pods fit in a rack; this equates to 40U racks. Using this information, along with the drive population and the power-on-date, I was able to calculate the number of pods on any given date as well as the total number of racks. I did not include their networking racks in which I believe they have two of these racks per row in their data center.
You can quickly see that Backblaze has done a great job at slowing the growth of the racks in their data center. This all results in lower costs for their customers.
Retiring Pods
What interested me when looking at Backblaze’s SMART data was the fact that drives were being retired more than they were failing. This means the cost of failures is fairly insignificant in the scheme of things. It is actually efficiencies driven by technology improvements such as drive and enclosure densities that drove most of the costs. However, the benefits must outweigh the costs. Being that Backblaze uses Sungard AS for its data centers, let’s try to visualize the benefit of retiring drives/pods.
Colocation Costs, Assuming a Given Density
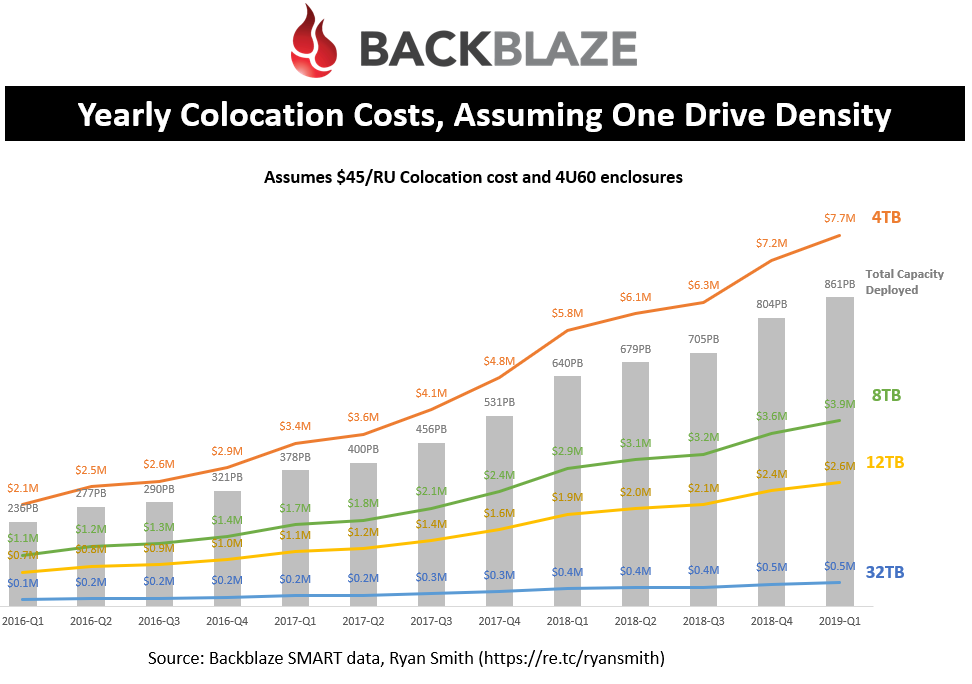
This shows the total capacity over time in Backblaze’s data centers, along with the colocation costs assuming all the drives were a given density. As you can see, in Q1’19 it would take $7.7M a year to pay for colocating costs of 861 PB if all the drives were 4 TB in size. By moving the entire population to 12 TB this can be reduced to $2.6M. So, just changing the drive density can have significant impacts on Backblaze’s operational costs. I did assume $45/RU costs in the analysis which means their costs may be as low as $15/RU based on the scale of their operation.
I threw in 32 TB densities to illustrate a hypothetical SSD-type density so you can see the colocation cost savings by moving to SSDs. Although lower, the acquisition costs are far too high at the moment to justify a move to SSDs.
Break-Even Analysis of Retiring Pods
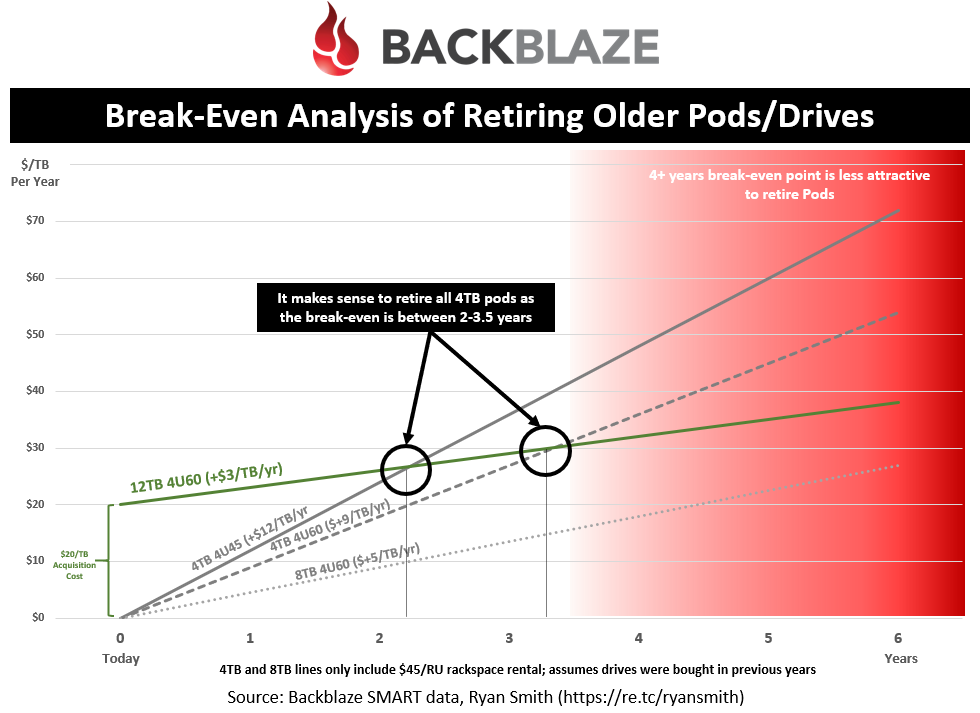
This chart helps illustrate the math behind deciding to retire older drives/pods based on the break-even point.
Let’s break down how to read this chart:
- This chart is looking at whether Backblaze should replace older drives with the newer 12 TB drives
- Assuming a cost of $0.02/GB for a 12 TB drive, that is a $20/TB acquisition cost you see on the far left
- Each line represents the cumulative cost over time (acquisition + operational costs)
- The grey lines (4 TB and 8 TB) all assume they were already acquired so they only represent operational costs ($0 acquisition cost) since we are deciding on replacement costs
- The operational costs (incremental yearly increase shown) is calculated off of the $45 per RU colocation cost and how many of this drive/enclosure density fits per rack unit. The more TBs you can cram into a rack unit, the lower your colocation costs are
Assuming you are still with me, this shows that the break-even point for retiring 4 TB 4U45 pods is just over two years! And 4 TB 4U60 pods at 3 years! It’s a no brainer to kill the 4 TB enclosures and replace them with 12 TB drives. Remember that this assumes a $45RU colocation cost so the break-even point will shift to the right if the colocation costs are lower (which they surely are).
You can see that the math to replace 8 TB drives with 12 TB doesn’t make as much sense so we may see Backblaze’s retirement strategy slow down dramatically after it retires the 4 TB capacity points.
As hard drive densities get larger and $/GB decreases, I expect the cumulative costs to start lower (less acquisition cost) and rise slower (less RU operational costs) making future drive retirements more attractive. Eyeballing it, it would be once $/GB approaches $0.01/GB to $0.015/GB.
Things Backblaze Should Look Into
Top of mind, Backblaze should look into these areas:
- The architecture around performance is not balanced; investigate having a caching tier to handle bursts and put more drives behind each storage node to reduce “enclosure/slot tax” costs.
- Look into designs like 5U84 from Seagate/Xyratex providing 16.8 drives per RU versus the 15 being achieved on Backblaze’s own 4U60 design; Another 12% efficiency!
- 5U allows for 8 pods to fit per rack versus the 10.
- Look at when SSDs will be attractive to replace HDDs at a given $/GB, density, idle costs, # of drives that fit per RU (using 2.5” drives instead of 3.5”) so that they can stay on top of this trend [there is no rush on this one].
- Performance and endurance of SSDs is irrelevant since the performance requirements are so low and the WPD is almost non-existence, making QLC and beyond a great candidate.
- Look at allowing pods to be more flexible in handling different capacity drives to handle drive failures more cost efficiently without having to retire pods. Having concepts of “virtual pods” that don’t have physical limits will better accommodate the future that Backblaze has where it won’t be retiring pods as aggressively, yet still let them grow their pod densities seamlessly.
In Closing
It is kind of ironic that the reason Backblaze posted all their SMART data is to share insights around failures when I didn’t even analyze failures once! There is much more analysis that could be done around this data set which I may revisit as time permits.
As you can see, even simple health data from drives, along with a little help from other data sources, can help expose a lot more than you would initially think. I have long felt that people have yet to understand the full power of giving data freely to businesses (e.g. Facebook, Google Maps, LinkedIn, Mint, Personal Capital, News Feeds, Amazon). I often hear things like, “I have nothing to hide,” which indicates the lack of value they assign to their data. It’s not the value at its surface but the story that can be told by tying data together.
Until next time, Ryan Smith.
• • •

Tell us what you think about Ryan’s take on data, or better yet, give us your own! You can find all the data you would ever need on Backblaze’s Hard Drive Data and Stats webpage. Share your thoughts in the comments below or email us at mailbag@backblaze.com.