Hard Drive Stats for 2019
As of December 31, 2019, Backblaze had 124,956 spinning hard drives. Of that number, there were 2,229 boot drives and 122,658 data drives. This review looks at the hard drive failure rates for the data drive models in operation in our data centers. In addition, we’ll take a look at how our 12 and 14 TB drives are doing and get a look at the new 16 TB drives we started using in Q4. Along the way we’ll share observations and insights on the data presented and we look forward to you doing the same in the comments.
2019 Hard Drive Failure Rates
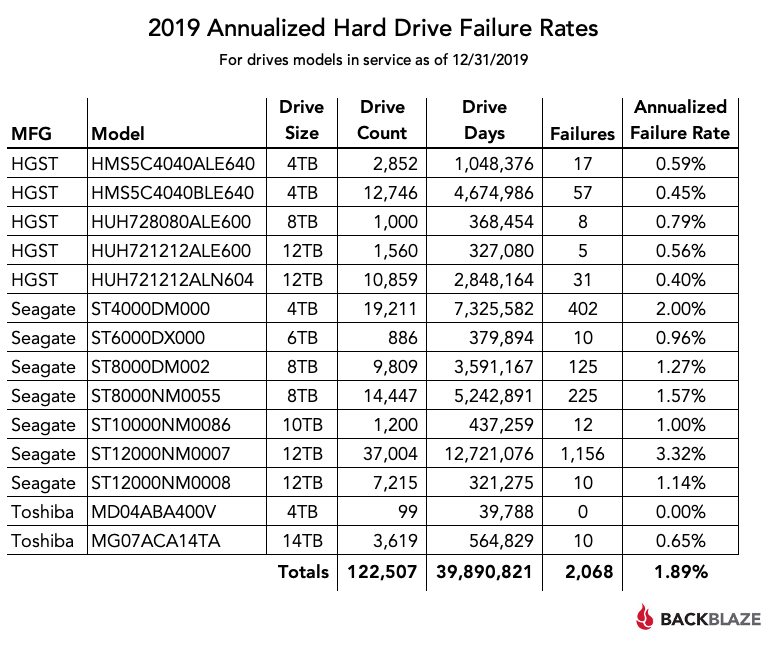
At the end of 2019 Backblaze was monitoring 122,658 hard drives used to store data. For our evaluation we remove from consideration those drives that were used for testing purposes and those drive models for which we did not have at least 5,000 drive days during Q4 (see notes and observations for why). This leaves us with 122,507 hard drives. The table below covers what happened in 2019.
Notes and Observations
There were 151 drives (122,658 minus 122,507) that were not included in the list above. These drives were either used for testing or did not have at least 5,000 drive days during Q4 of 2019. The 5,000 drive-day limit removes those drive models where we only have a limited number of drives working a limited number of days during the period of observation. NOTE: The data for all drives, data drives, boot drives, etc., is available for download on the Hard Drive Test Data webpage.
The only drive model not to have a failure during 2019 was the 4 TB Toshiba, model: MD04ABA400V. That’s very good, but the data sample is still somewhat small. For example, if there had been just 1 (one) drive failure during the year, the Annualized Failure Rate (AFR) for that Toshiba model would be 0.92%—still excellent, not 0%.
The Toshiba 14 TB drive, model MG07ACA14TA, is performing very well at a 0.65% AFR, similar to the rates put up by the HGST drives. For their part, the Seagate 6 TB and 10 TB drive continue to be solid performers with annualized failure rates of 0.96% and 1.00% respectively.
The AFR for 2019 for all drive models was 1.89% which is much higher than 2018. We’ll discuss that later in this review.
Beyond the 2019 Chart—“Hidden” Drive Models
There are a handful of drive models that didn’t make it to the 2019 chart because they hadn’t recorded enough drive-days in operation. We wanted to take a few minutes to shed some light on these drive models and where they are going in our environment.
Seagate 16 TB Drives
In Q4 2019 we started qualifying Seagate 16 TB drives, model: ST16000NM001G. As of the end of Q4 we had 40 (forty) drives in operation, with a total of 1,440 drive days—well below our 5,000 drive day threshold for Q4, so they didn’t make the 2019 chart. There have been 0 (zero) failures through Q4, making the AFR 0%, a good start for any drive. Assuming they continue to pass our drive qualification process, they will be used in the 12 TB migration project and to add capacity as needed in 2020.
Toshiba 8 TB Drives
In Q4 2019 there were 20 (twenty) Toshiba 8 TB drives, model: HDWF180. These drives have been installed for nearly two years. In Q4, they only had 1,840 drive days, below the reporting threshold, but lifetime they do have 13,994 drive days with only 1 drive failure, giving us an AFR of 2.6%. We like these drives, but by the time they were available to us in quantity, we could buy 12 TB drives at the same cost per TB. More density, same price. Given we are moving to 16 TB drives and beyond, we most likely will not be buying any of these drives in the future.
HGST 10 TB Drives
There are 20 (twenty) HGST 10 TB drives, model: HUH721010ALE600 in the operation. These drives have been in service a little over one year. They reside in the same Backblaze Vault as the Seagate 10 TB drives. The HGST drives recorded only 1,840 drive days in Q4 and a total of 8,042 since being installed. There have been 0 (zero) failures. As with the Toshiba 8 TB, purchasing more of these 10 TB drives is unlikely.
Toshiba 16 TB Drives
You won’t find these in the Q4 stats, but in Q1 2020 we added 20 (twenty) Toshiba 16 TB drives, model: MG08ACA16TA. They have logged a total of 100 drive days, so it is way too early to say anything other than more to come in the Q1 2020 report.
Comparing Hard Drive Stats for 2017, 2018, and 2019
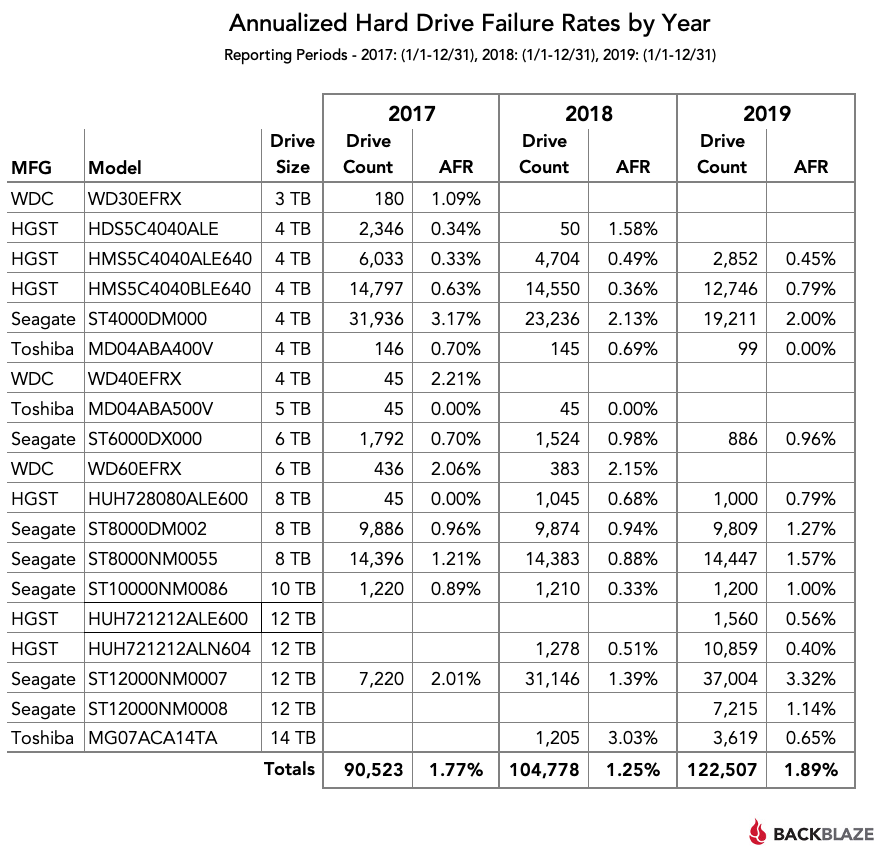
The chart below compares the Annualized Failure Rates (AFR) for each of the last three years. The data for each year is inclusive of that year only and for the drive models present at the end of each year.
The Rising AFR in 2019
The total AFR for 2019 rose significantly in 2019. About 75% of the different drive models experienced a rise in AFR from 2018 to 2019. There are two primary drivers behind this rise. First, the 8 TB drives as a group seem to be having a mid-life crisis as they get older, with each model exhibiting their highest failure rates recorded. While none of the rates is cause for worry, they contribute roughly one fourth (1/4) of the drive days to the total, so any rise in their failure rate will affect the total. The second factor is the Seagate 12 TB drives, this issue is being aggressively addressed by the 12 TB migration project reported on previously.
The Migration Slows, but Growth Doesn’t
In 2019 we added 17,729 net new drives. In 2018, a majority of the 14,255 drives added were due to migration. In 2019, less than half of the new drives were for migration with the rest being used for new systems. In 2019 we decommissioned 8,800 drives totaling 37 Petabytes of storage and replaced them with 8,800 drives, all 12 TB, totaling about 105 Petabytes of storage, then we added an additional 181 Petabytes of storage in 2019 using 12 TB and 14 TB drives.
Drive Diversity
Manufacturer diversity across drive brands increased slightly in 2019. In 2018, Seagate drives were 78.15% of the drives in operation, by the end of 2019 that percentage had decreased to 73.28%. HGST went from 20.77% in 2018, to 23.69% in 2019, and Toshiba increased from 1.34% in 2018 to 3.03% in 2019. There were no Western Digital branded drives in the data center in 2019, but as WDC rebrands the newer large-capacity HGST drives, we’ll adjust our numbers accordingly.
Lifetime Hard Drive Stats
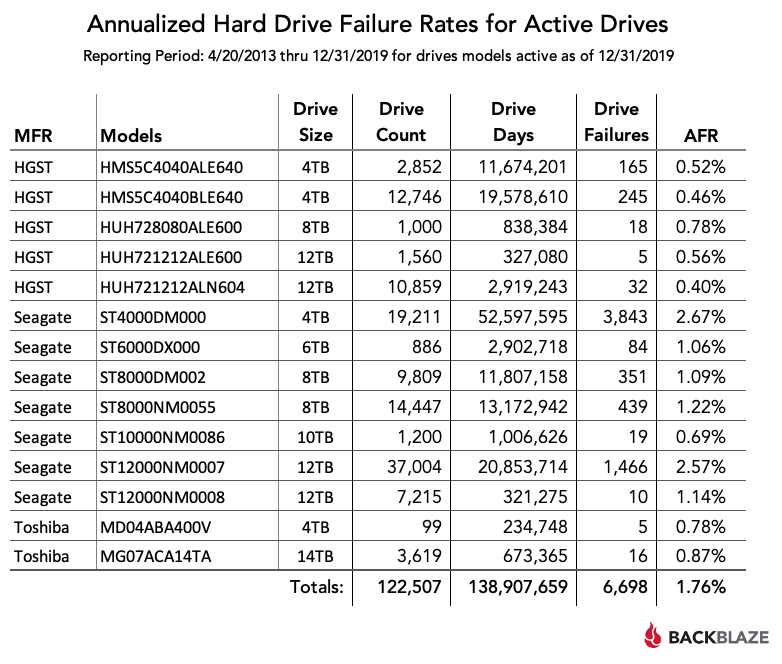
While comparing the annual failure rates of hard drives over multiple years is a great way to spot trends, we also look at the lifetime annualized failure rates of our hard drives. The chart below shows the annualized failure rates of all of the drives models in production as of 12/31/2019.
The Hard Drive Stats Data
The complete data set used to create the information used in this review is available on our Hard Drive Test Data page. You can download and use this data for free for your own purposes. All we ask are three things: 1) you cite Backblaze as the source if you use the data, 2) you accept that you are solely responsible for how you use the data, and 3) you do not sell this data to anyone; it is free.
If you just want the summarized data used to create the tables and charts in this blog post, you can download the ZIP file containing the CSV files for each chart.
Good luck and let us know if you find anything interesting.