What if a hard drive could tell you it was going to fail before it actually did? Is that possible? Each day Backblaze records the SMART stats that are reported by the 67,814 hard drives we have spinning in our Sacramento data center. SMART stands for Self-Monitoring, Analysis, and Reporting Technology and is a monitoring system included in hard drives that reports on various attributes of the state of a given drive.
While we’ve looked at SMART stats before, this time we’ll dig into the SMART stats we use in determining drive failure and we’ll also look at a few other stats we find interesting.
We use Smartmontools to capture the SMART data. This is done once a day for each hard drive. We add in a few elements, such as drive model, serial number, etc. and create a row in the daily log for each drive. You can download these logs files from our website. Drives which have failed are marked as such and their data is no longer logged. Sometimes a drive will be removed from service even though it has not failed, like when we upgrade a Storage Pod by replacing 1TB drives with 4TB drives. In this case, the 1TB drive is not marked as a failure, but the SMART data will no longer be logged.
SMART Stats We Use to Predict Hard Drive Failure
For the last few years we’ve used the following five SMART stats as a means of helping determine if a drive is going to fail.
| Attribute | Description | |
|---|---|---|
| SMART 5 | Reallocated Sectors Count | |
| SMART 187 | Reported Uncorrectable Errors | |
| SMART 188 | Command Timeout | |
| SMART 197 | Current Pending Sector Count | |
| SMART 198 | Uncorrectable Sector Count |
When the RAW value for one of these five attributes is greater than zero, we have a reason to investigate. We also monitor RAID array status, Backblaze Vault array status and other Backblaze internal logs to identify potential drive problems. These tools generally only report exceptions, so on any given day the number of investigations is manageable even though we have nearly 70,000 drives.
Let’s stay focused on SMART stats and take a look at the table below which shows percentage of both failed and operational drives, which are reporting a RAW value that is greater than zero for the SMART stat listed.
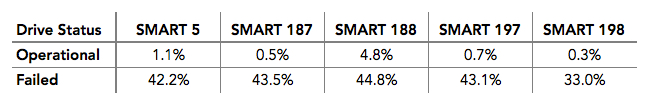
While no single SMART stat is found in all failed hard drives, here’s what happens when we consider all five SMART stats as a group.
Operational drives with one or more of our five SMART stats greater than zero: 4.2%.
Failed drives with one or more of our five SMART stats greater than zero: 76.7%.
That means that 23.3% of failed drives showed no warning from the SMART stats we record. Are these stats useful? I’ll let you decide if you’d like to have a sign of impending drive failure 76.7% of the time. But before you decide, read on.
Having a given drive stat with a value that is greater than zero may mean nothing at the moment. For example, a drive may have a SMART 5 raw value of two, meaning two drive sectors have been remapped. On its own, such a value means little until combined with other factors. The reality is it can take a fair amount of intelligence (both human and artificial) during the evaluation process to reach the conclusion that an operational drive is going to fail.
One thing that helps is when we observe multiple SMART errors. The following chart shows the incidence of having one, two, three, four or all five of the SMART stats we track have a raw value that is greater than zero.
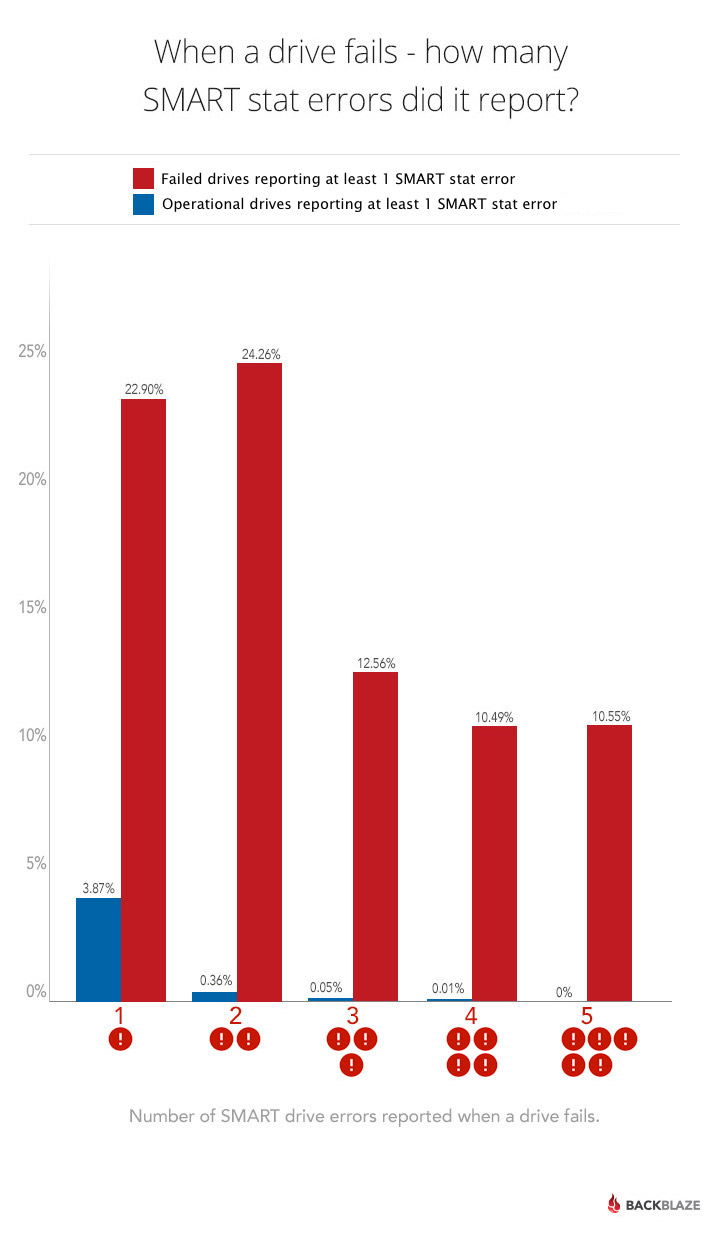 To clarify, a value of one means that of the five SMART stats we track, only one has a value greater than zero, while a value of five means that all five SMART stats we track have a value greater than zero. But, before we decide that multiple errors help, let’s take a look at the correlation between these SMART stats as seen in the chart below.
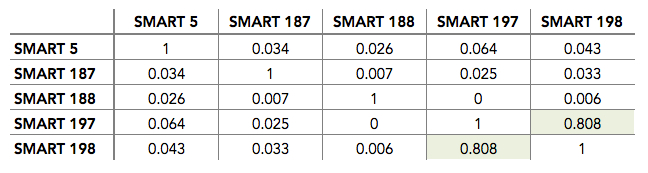
In most instances, the stats have little correlation and can be considered independent. Only SMART 197 and 198 have a good correlation, meaning we could consider them as one indicator versus two. Why do we continue to collect both SMART 197 and SMART 198? Two reasons: 1) the correlation isn’t perfect, so there’s room for error, and 2) not all drive manufacturers report both attributes.
How does understanding the correlation, of lack thereof, of these SMART stats help us? Let’s say, a drive reported a SMART 5 raw value of 10 and SMART 197 raw value of 20. From that we could conclude the drive is deteriorating and should be scheduled for replacement. Whereas, if the same drive had SMART 197 raw value of 5 and a SMART 198 raw value of 20 and no other errors, we might hold off on replacing the drive awaiting more data, such as the frequency of the errors occurring.
Error Distribution
So far it might sound like we will fail a hard drive if we just observe enough SMART values that are greater than zero, but we also have to factor time into the equation. The SMART stats we track, with the exception of SMART 197, are cumulative in nature, meaning we need to consider the time period over which the errors were reported.
For example, let’s start with a hard drive that jumps from zero to 20 reported uncorrectable errors (SMART 187) in one day. Compare that to a second drive which has a count of 60 SMART 187 errors, with one error occurring on average once a month over a five year period. Which drive is a better candidate for failure?
Another Stat to Consider: SMART 189—High Fly Writes
This is a stat we’ve been reviewing to see if it will join our current list of five SMART stats we use today. This stat is the cumulative count of the number of times the recording head “flies” outside its normal operating range. Below we list the percentage of operational and failed drives where the SMART 189 raw value is greater than zero.
Failed Drives: 47.0%.
Operational Drives: 16.4%.
The false positive percentage of operational drives having a greater than zero value may at first glance seem to render this stat meaningless. But what if I told you that for most of the operational drives with SMART 189 errors, that those errors were distributed fairly evenly over a long period of time. For example, there was one error a week on average for 52 weeks. In addition, what if I told you that many of the failed drives with this error had a similar number of errors, but they were distributed over a much shorter period of time, for example 52 errors over a one week period. Suddenly, SMART 189 looks very interesting in predicting failure by looking for clusters of high fly writes over a small period of time. We are currently in the process of researching the use of SMART 189 to determine if we can define a useful range of rates at which errors occur.
SMART 12: Power Cycles
Is it better to turn off your computer when you are not using it or should you leave it on? The debate has raged on since the first personal computers hit the market in the 80s. On one hand, turning off a computer “saves” the components inside and saves a little on your electricity bill. On the other hand, the shut down/start up process is tough on the components, especially the hard drive.
Will analyzing the SMART 12 data finally allow us to untie this Gordian knot?
Let’s compare the number of power cycles (SMART 12) of failed drives versus operational drives.
Failed drives were power cycled on average: 27.7 times.
Operational drives were power cycled on average: 10.2 times.
At first blush, it would seem we should keep our systems running as the failed drives had 175% more power cycles versus drives that have not failed. Alas, I don’t think we can declare victory just yet. First, we don’t power cycle our drives very often. On average, drives get power cycled about once every couple of months. That’s not quite the same as turning off your computer every night. Second, we didn’t factor in the age range of the drives. To do that, we’d need a lot more data points to get results we could rely on. That means, sadly, we don’t have enough data to reach a conclusion.
Perhaps one of our stat-geek readers will be able to tease out a conclusion regarding power cycles. Regardless, everyone is invited to download and review our hard drive stats data including the SMART stats for each drive. If you find anything interesting, let us know.