Welcome to the first SSD edition of the Backblaze Drive Stats report. This edition will focus exclusively on our SSDs as opposed to our quarterly and annual Drive Stats reports which, until last year, focused exclusively on HDDs. Initially we expect to publish the SSD edition twice a year, although that could change depending on its value to our readers. We will continue to publish the HDD Drive Stats reports quarterly.
Background
The SSDs in this report are all boot drives in our storage servers. In our early storage servers, we used HDDs exclusively for boot drives. We began using SSDs in this capacity in Q4 of 2018. Since that time, all new storage servers and any with failed HDD boot drives have had SSDs installed. Boot drives in our environment do much more than boot the storage servers, they also store log files and temporary files produced by the storage server. Each day a boot drive will read, write, and delete files depending on the activity of the storage server itself.
Overview
As of December 31, 2021, we were using 2,200 SSDs. As we share various tables and charts below, some of the numbers, particularly the annualized failure rate (AFR) will be very surprising to informed readers. For example, an AFR of 43.22% might catch your attention. We will explain these outliers as we go along. Most are due to the newness of a drive, but we’ll let you know.
As with the HDD reports, we have published the data we used to develop our SSD report. In fact, we have always published this data as it resides in the same files as the HDD data. Now for the bad news: The data does not currently include a drive type, SDD or HDD, so you’ll have to do your research by model number. Sorry. You’ll find the links to download the data files on our Drive Stats Test Data webpage. If you are just looking for SSD data, start with Q4 2018 and go forward.
If you are new to our Drive Stats reports, you might wonder why we collect and share this information. It starts with the fact that we have lots of data storage available, over two exabytes to date, for customers using the Backblaze B2 Cloud Storage and Backblaze Computer Backup services. In doing that, we need to have a deep understanding of our environment, one aspect of which is how often drives, both HDDs and SSDs, fail. Starting about seven years ago we decided to share what we learned and shed some light on the previously opaque world of hard drive failure rates. It is only natural that we would be as transparent with SSDs. Read on.
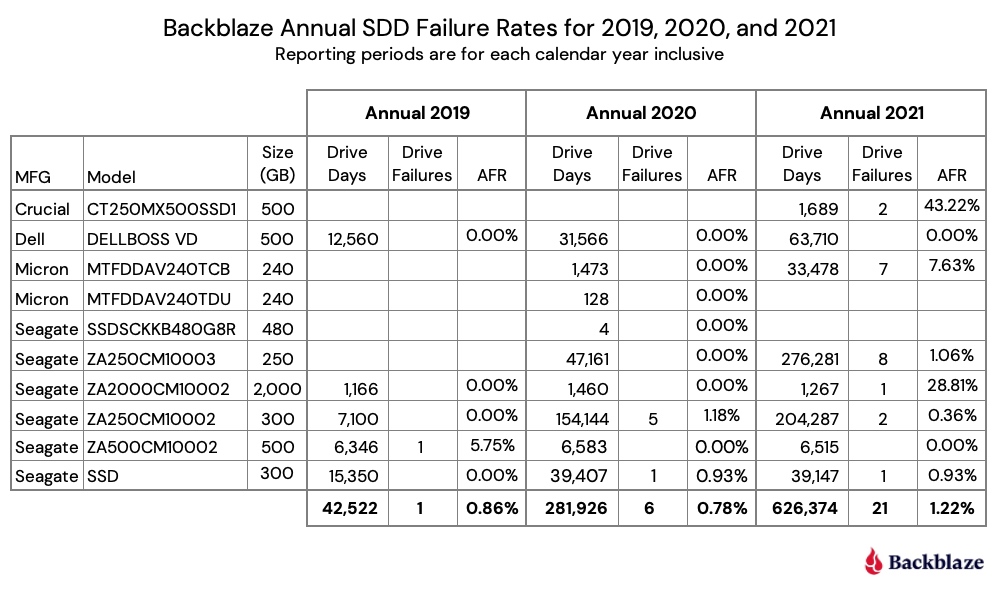
Annual SSD Failure Rates for 2019, 2020, and 2021
At the end of 2021, there were 2,200 SSDs in our storage servers, having grown from zero in Q3 2018. We’ll start with looking at the AFR for the last three years, then dig into 2021 failure rates, and finally, take a look at the monthly AFR rates since 2019. We’ll explain each as we go.
The chart below shows the failure rates for 2019, 2020, and 2021.
Observations and Comments
- The data for each year (2019, 2020, and 2021) is inclusive of the activity which occurred in that year.
- There is an upward direction in the failure rate for 2021. We saw this when we compared our HDD and SSD boot drives in a previous post. When we get to the quarter-by-quarter chart later in this blog post, this trend, as such, will be much clearer.
- Two drives have eye-popping failure rates—the Crucial model: CT250MX500SSD1 and the Seagate model: ZA2000CM10002. In both cases, the drive days and drive count (not shown) are very low. For the Crucial, there are only 20 drives which were installed in December 2021. For the Seagate, there were only four drives and one failed in early 2021. In both cases, the AFR is based on very little data, which leads to a very wide confidence interval, which we’ll see in the next section. We include these drives for completeness.
- A drive day denotes one drive in operation for one day. Therefore, one drive in operation for 2021 would have 365 drive days. If a drive fails after 200 days, it will have 200 drive days and be marked as failed. For a given cohort of drives over a specified period of time, we compute the AFR as follows:AFR = (drive failures / (drive days / 365)) * 100
This provides the annualized failure rate (AFR) over any period of time.
2021 Annual SSD Failure Rates
Let’s dig into 2021 and add a few more details. The table below is an expanded version of the annual 2021 section from the previous chart.
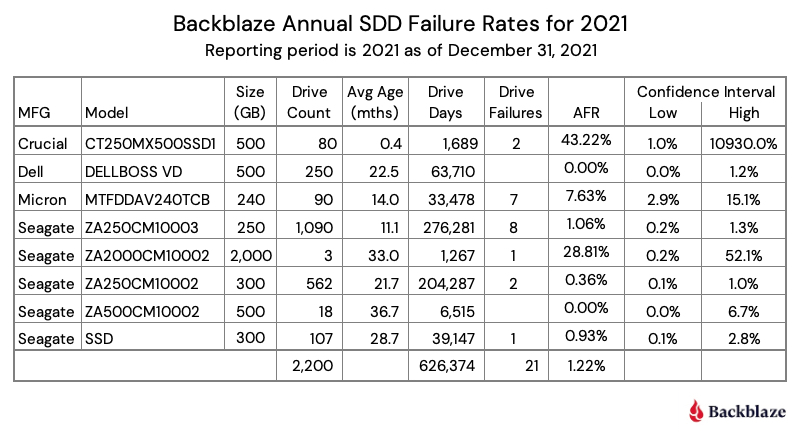
From the table, it should be clear that the Crucial and Seagate drives with the double-digit AFRs require a lot more data before passing any judgment on their reliability in our environment. This is evidenced by the extremely wide confidence interval for each drive. A respectable confidence interval is less than 1.0%, with 0.6% or less being optimal for us. Only the Seagate model: ZA250CM10002 meets the 1.0% percent criteria, although the Seagate model: ZA250CM10003 is very close.
Obviously, it takes time to build up enough data to be confident that the drive in question is performing at the expected level. In our case, we expect a 1% to 2% AFR. Anything less is great and anything more bears watching. One of the ways we “watch” is by tracking quarterly results, which we’ll explore next.
Quarterly SSD Failure Rates Over Time
There are two different ways we can look at the quarterly data: over discrete periods of time, e.g., a quarter or year; or cumulative over a period of time, e.g., all data since 2018. Data scoped to quarter by quarter can be volatile or spikey, but reacts quickly to change. Cumulative data shows longer term trends, but is less reactive to quick changes.
Below are graphs of both the quarter-by-quarter and cumulative-by-quarter data for our SSDs beginning in Q1 2019. First we’ll compare all SSDs, then we’ll dig into a few individual drives of interest.
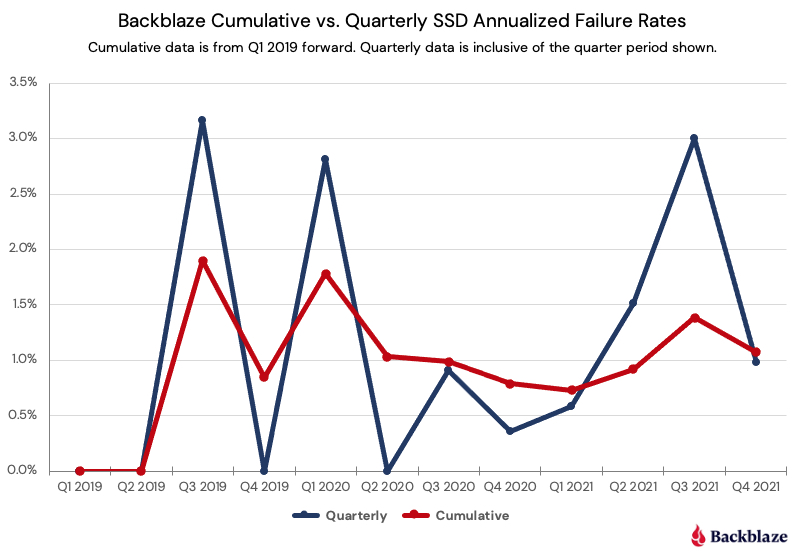
The cumulative curve flows comfortably below our 2% AFR threshold of concern. If we had just followed the quarterly number, we might have considered the use of SSDs as boot drives to be problematic, as in multiple quarters the AFR was at or near 3%. That said, the more data the better, and as the SSDs age we’ll want to be even more on alert to see how long they last. We have plenty of data on that topic for HDDs, but we are still learning about SDDs.
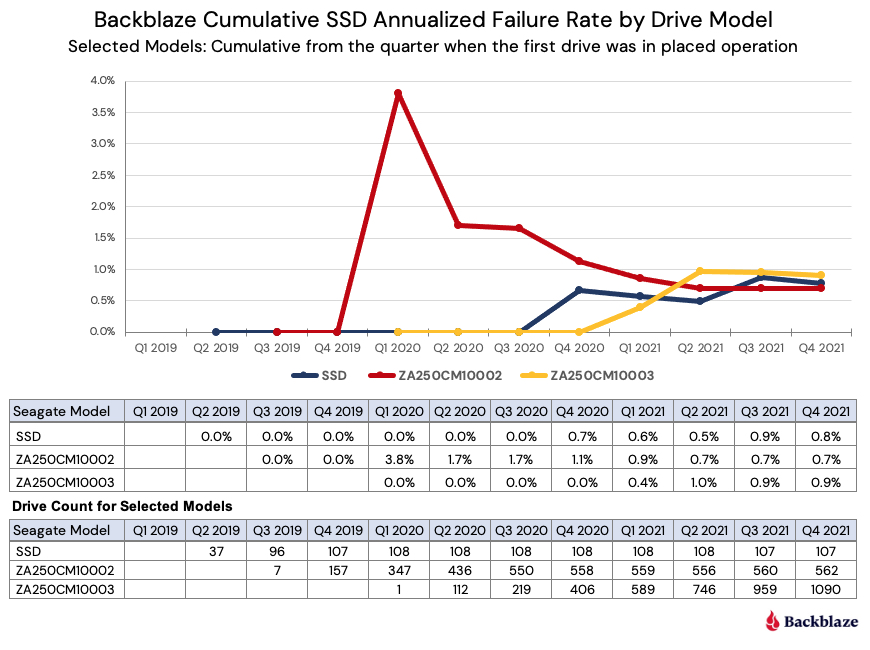
With that in mind, let’s take a look at three of the older SSDs to see if there is anything interesting at this point.
Observations and Comments
- For all of 2021, all three drives have had cumulative AFR rates below 1%.
- This compares to the cumulative AFR for all SSD drives as of Q4 2021 which was 1.07% (from the previous chart).
- Extending the comparison, the cumulative (lifetime) AFR for our hard drives was 1.40% as noted in our 2021 Drive Stats report. But, as we have noted in our comparison of HDDs and SSDs, the two groups (SSDs and HDDs) are not at the same point in their life cycles. As promised, we’ll continue to examine that dichotomy over the coming months.
- The model (ZA250CM10002) represented by the red line seems to be following the classic bathtub failure curve, experiencing early failures before settling down to an AFR below 1%. On the other hand, the other two drives showed no signs of early drive failure and have only recently started failing. This type of failure pattern is similar to that demonstrated by our HDDs which no longer fit the bathtub curve model.
Experiments and Test Drives
If you decide to download the data and poke around, you’ll see a few anomalies related to the SSD models. We’d like to shed some light on these outliers before you start poking around. We’ve already covered the Crucial and Seagate drives that had higher than expected AFR numbers, but there are two other SSD models that don’t show up in this report, but do show up in the data. These are the Samsung 850 EVO 1TB and the HP SSD S700 250GB.
Why don’t they show up in this report? As with our drive stats review for our HDDs, we remove those drives we are using for testing purposes. Here are the details:
- The Samsung SSDs were the first SSDs to be installed as boot drives. There were 10 drives that were installed to test out how SSDs would work as boot drives. Thumbs up! We had prior plans for these 10 drives in other servers and after about two weeks, the Samsung drives were swapped out with other SSDs and deployed for their original purpose. Their pioneering work was captured in the Drive Stats data for posterity.
- The HP SSDs that were part of the testing of our internal data migration platform, i.e., moving data from smaller drives to larger drives. These drives showed up in the data in Q3 and Q4 of 2021. Any data related to these drives in Q3 or Q4 is not based on using these drives in our production environment.
What’s Next
We acknowledge that 2,200 SSDs is a relatively small number of drives on which to perform our analysis, and while this number does lead to wider than desired confidence intervals, we had to start somewhere. Of course, we will continue to add SSD boot drives to the study group, which will improve the fidelity of the data presented. In addition, we expect our readers will apply their usual skeptical lens to the data presented and help guide us towards making this report increasingly educational and useful.
We do have SSDs in other types of servers in our environment. For example, restore servers, utility servers, API servers, and so on. We are considering instrumenting the drives in some of those servers so that they can report their stats in a similar fashion as our boot drives. There are multiple considerations before we do that:
- We don’t impact the performance of the other servers.
- We recognize the workload of the drives in each of the other servers is most likely different. This means we could end up with multiple cohorts of SSD drives, each with different workloads, that may or may not be appropriate to group together for our analysis.
- We don’t want to impact the performance of our data center techs to do their job by adding additional or conflicting steps to the processes they use when maintaining those other servers.
The SSD Stats Data
The complete data set used to create the information used in this review is available on our Hard Drive Test Data page. As noted earlier, you’ll find SSD and HDD data in the same files and you’ll have to use the model number to distinguish one record from another. You can download and use this data for free for your own purpose. All we ask are three things: 1) you cite Backblaze as the source if you use the data, 2) you accept that you are solely responsible for how you use the data, and 3) you do not sell this data to anyone; it is free.
Good luck and let us know if you find anything interesting.