In 2021, Backblaze added 40,460 hard drives and as of December 31, 2021, we had 206,928 drives under management. Of that number, there were 3,760 boot drives and 203,168 data drives. This report will focus on our data drives. We will review the hard drive failure rates for 2021, compare those rates to previous years, and present the lifetime failure statistics for all the hard drive models active in our data center as of the end of 2021. Along the way, we share our observations and insights on the data presented and, as always, we look forward to you doing the same in the comments section at the end of the post.
2021 Hard Drive Failure Rates
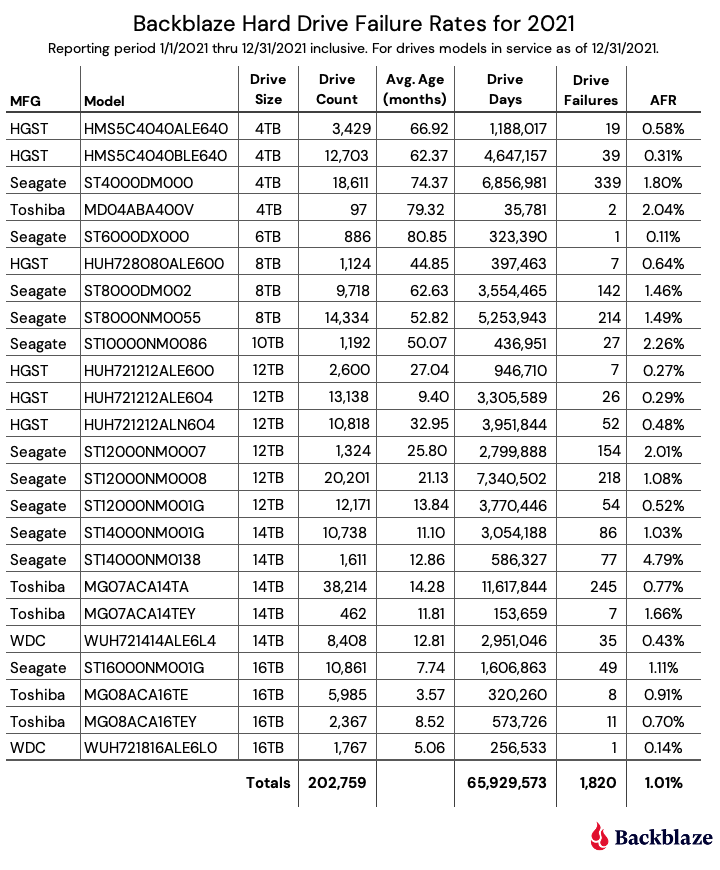
At the end of 2021, Backblaze was monitoring 203,168 hard drives used to store data. For our evaluation, we removed 409 drives from consideration which were used for either testing purposes or drive models for which we did not have at least 60 drives. This leaves us with 202,759 hard drives to analyze for this report.
Observations and Notes
The Old Guy Rules: For 2021, the 6TB Seagate (model: ST6000DX000) had the lowest failure rate of any drive model, clocking in with an annualized failure rate (AFR) of 0.11%. This is even more impressive when you consider that this 6TB drive model is the oldest in the fleet with an average age of 80.4 months. The number of drives, 886, and 2021 drive days, 323,390, are on the lower side, but after nearly seven years in operation, these drives are thumbing their nose at the tail end of the bathtub curve.
The Kids Are Alright: Two drive models are new for 2021 and both are performing well. The 16TB WDC drive cohort (model: WUH721816ALE6L0) has an average age of 5.06 months and an AFR of 0.14%. While the 16TB Toshiba drive cohort (model: MG08ACA16TE) has an average age of 3.57 months and an AFR of 0.91%. In both cases, the number of drive days is on the lower side, but these two drive models are off to a good start.
AFR, What Does That Mean?
AFR stands for annualized failure rate. This is different from an annual failure rate in which the number of drives is the same for each model (cohort) throughout the annual period. In our environment, drives are added and leave throughout the year. For example, a new drive installed in Q4 might contribute just 43 days, while a drive that failed in July might contribute 186 days, while drives in continuous operation for the year could contribute 365 days each. We count the number of drive days each drive contributes throughout the period and annualize the total using this formula:
The Patient Is Stable: Last quarter, we reported on the state of our 14TB Seagate drives (model: ST14000NM0138) provisioned in Dell storage servers. They were failing at a higher than expected rate and everyone—Backblaze, Seagate, and Dell—wanted to know why. The failed drives were examined by fault analysis specialists and in late Q3 it was decided as a first step to upgrade the firmware for that cohort of drives still in service. The results were that the quarterly failure rate dropped from 6.29% in Q3 to 4.66% in Q4, stabilizing the rapid rise in failures we’d seen in Q2 and Q3. The 19 drives that failed in Q4 were shipped off for further analysis. We’ll continue to follow this process over the coming quarters.
The AFR for 2021 for all drive models was 1.01%, which was slightly higher than the 0.93% we reported for 2020. The next section will compare the data from the last three years.
Comparing Drive Stats for 2019, 2020, and 2021
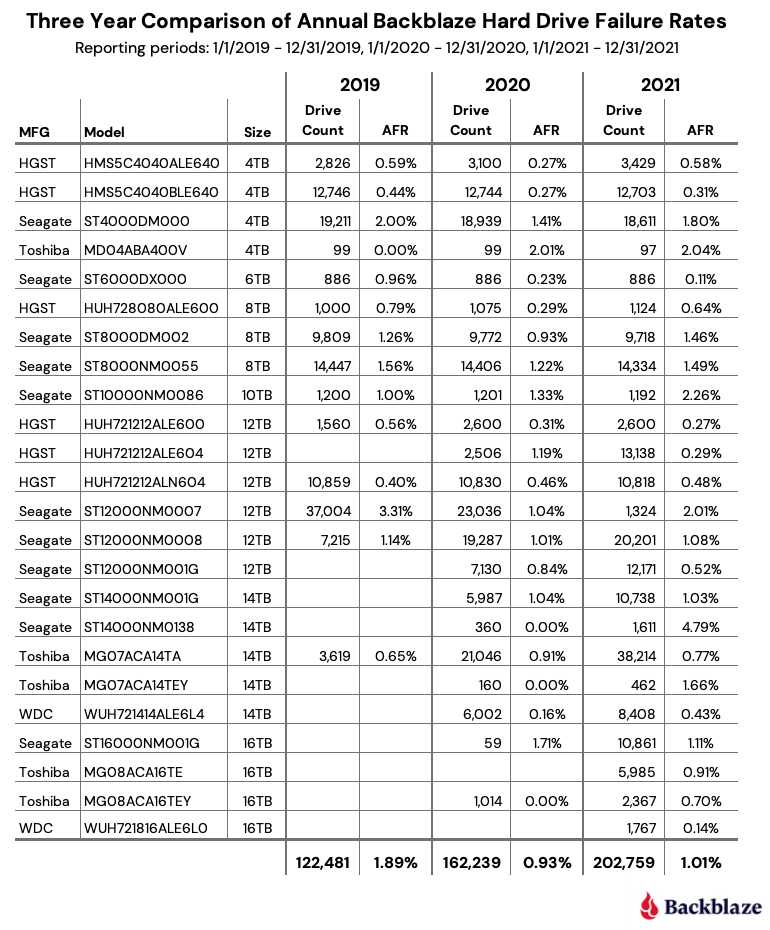
The chart below compares the AFR for each of the last three years. The data for each year is inclusive of that year only and for the active drive models present at the end of each year.
Digging a little deeper, we can aggregate the different drive models by manufacturer to see how failure rates per manufacturer have fared over the last three years.
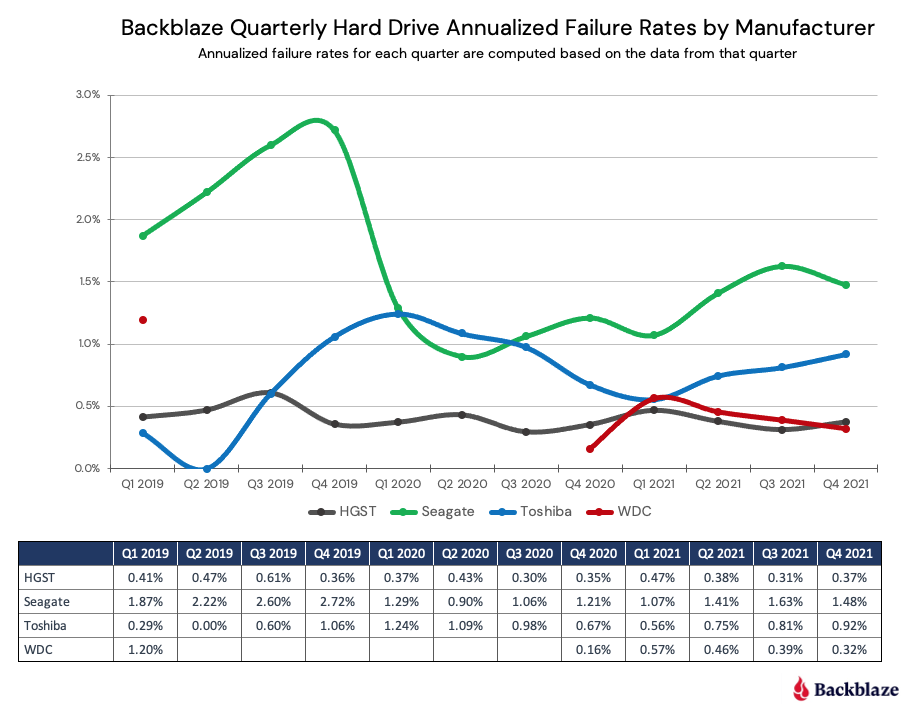
Note that for the WDC data, a blank value means we did not have any countable WDC drives in our data center in that quarter.
Trends for 2021
The AFR Stayed Low in 2021: In 2021, the AFR for all drives was 1.01%. This was slightly higher than 2020 at 0.93%, but a good sign that the drop in 2020 from 1.83% in 2019 was not an anomaly. What’s behind the 1.01% for 2021? Large drives, as seen below:
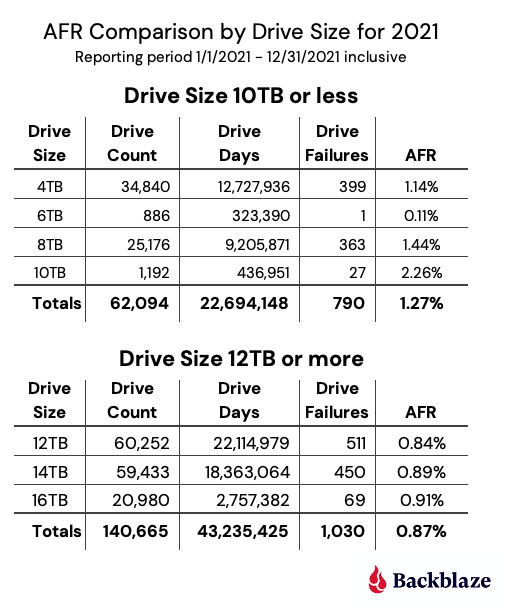
The AFR for larger drives, defined here as 12TB, 14TB, and 16TB drives, are all below the 2021 AFR of 1.01% for all drives. The larger drives make up 69% of the total drive population, but more importantly, they total 66% of the drive days total, while only producing 57% of the drive failures.
The larger drives are also the newer drives, which tend to fail less versus older drives. In fact, the oldest large drive has an average age 33 months, while the youngest “small” (4TB, 6TB, 8TB, and 10TB) drive has an average age of 44.9 months.
In summary, the lower AFR for the larger drives is a major influence in keeping the overall AFR for 2021 low.
Drive Model Diversity Continues: In 2021, we added two new drive models to our farm with no models retired. We now have a total of 24 different drive models in operation. That’s up from a low point of 14 in 2019 and 22 in 2020. The chart below for “Backblaze Hard Drive Population Percentage by Manufacturer” examines the changing complexion of our drive farm as we look at the number of models from each manufacturer we used over the past six years.
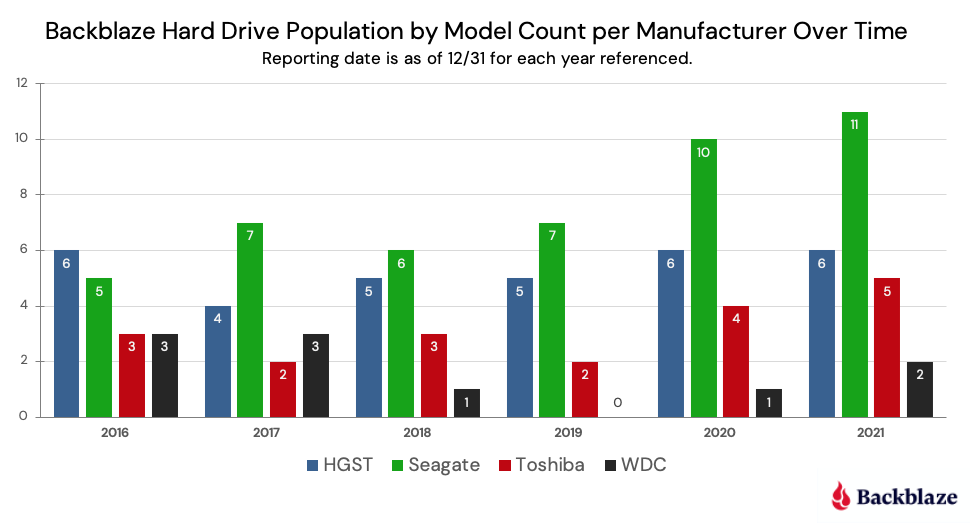
When we first started, we often mixed and matched drive models, mostly out of financial necessity—we bought what we could afford. As we grew, we bought and deployed drives in larger lots and drive homogeneity settled in. Over the past few years, we have gotten more comfortable with mixing and matching again, enabled by our Backblaze Vault architecture. A Vault is composed of sixty tomes, with each tome being 20 drives. We make each tome the same drive model, but each of the tomes within a vault can have different drive models, and even different drive sizes. This allows us to be less reliant on any particular drive model, so the more drive models the better.
Drive Vendor Diversity Continues, Too: When looking at the chart above for “Backblaze Hard Drive Population by Model Count per Manufacturer Over Time,” you might guess that we have increased the percentage of Seagate drives over the last couple of years. Let’s see if that’s true.
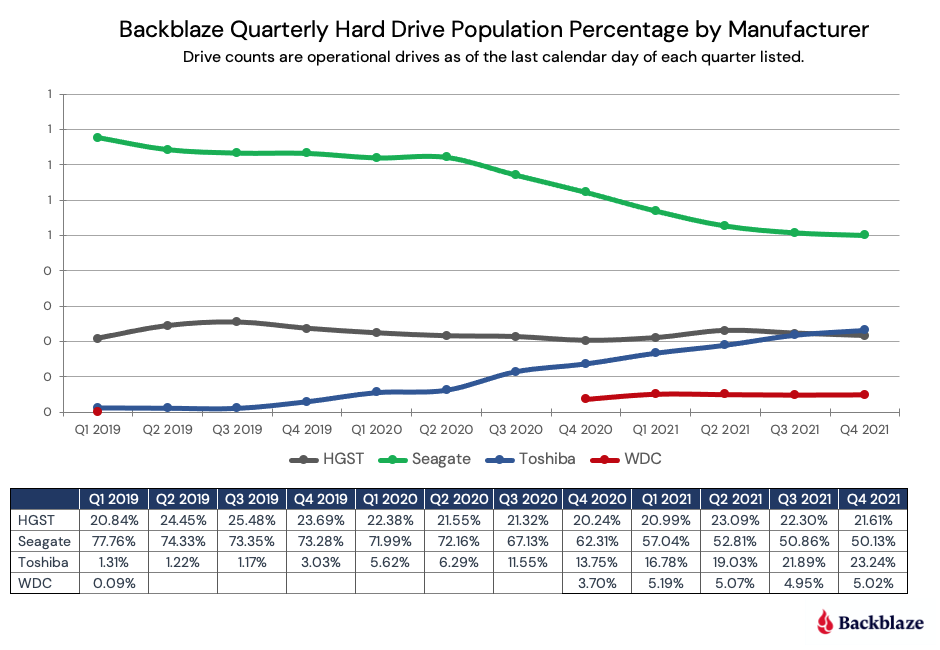
It appears the opposite is true, we have lowered the percentage of Seagate drives in our data centers, even though we have added additional Seagate models.
Why is it important to diversify across multiple manufacturers? Flexibility, just like increasing the number of models. Having relationships with all the primary hard drive vendors gives us the opportunity to get the resources we need in a timely fashion. The fact that we can utilize any one of several different models from these vendors adds to that flexibility.
Lifetime Hard Drive Stats
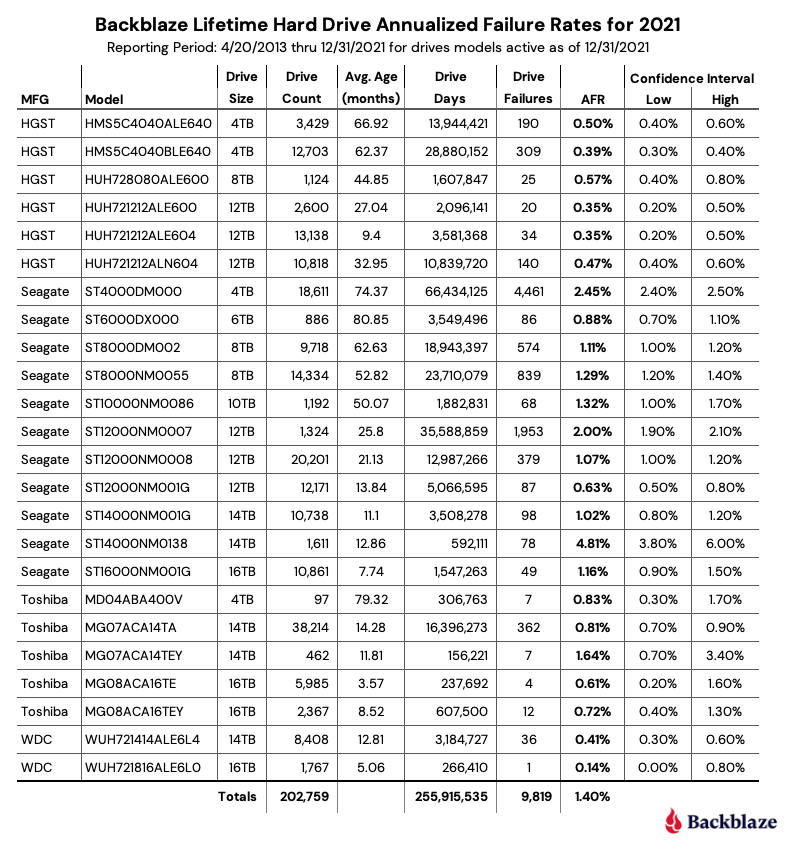
The chart below shows the lifetime annualized failure rates of all the drive models in production as of December 31, 2021.
Observations and Caveats
The lifetime AFR for all the drives listed above is 1.4% and continues to go down year over year. At the end of 2020, the AFR was 1.54% and at the end of 2019, the AFR stood at 1.62%.
When looking at the chart above, several of the drives have a fairly wide confidence interval (>0.5). In these cases, we do not really have enough information about the drive’s performance to be reasonably confident (>95%) in the AFR listed. This is typically the case with lower drive counts or newer drives.
Looking for SSD Numbers?
We’ll be covering our annual failure rates for our SSD drives in a separate post in the next few weeks. We realized that combining the analysis of our data drives and our boot drives in one post was confusing. Stay tuned.
The Hard Drive Stats Data
The complete data set used to create the information used in this review is available on our Hard Drive Test Data page. You can download and use this data for free for your own purpose. All we ask are three things: 1) you cite Backblaze as the source if you use the data, 2) you accept that you are solely responsible for how you use the data, and 3) you do not sell this data to anyone; it is free.
If you just want the summarized data used to create the tables and charts in this blog post, you can download the ZIP file containing the CSV files for each chart.
Good luck and let us know if you find anything interesting.