As of December 31, 2022, we had 235,608 drives under management. Of that number, there were 4,299 boot drives and 231,309 data drives. This report will focus on our data drives. We’ll review the hard drive failure rates for 2022, compare those rates to previous years, and present the lifetime failure statistics for all the hard drive models active in our data center as of the end of 2022. Along the way, we’ll share our observations and insights on the data presented and, as always, we look forward to you doing the same in the comments section at the end of the post.
2022 Hard Drive Failure Rates
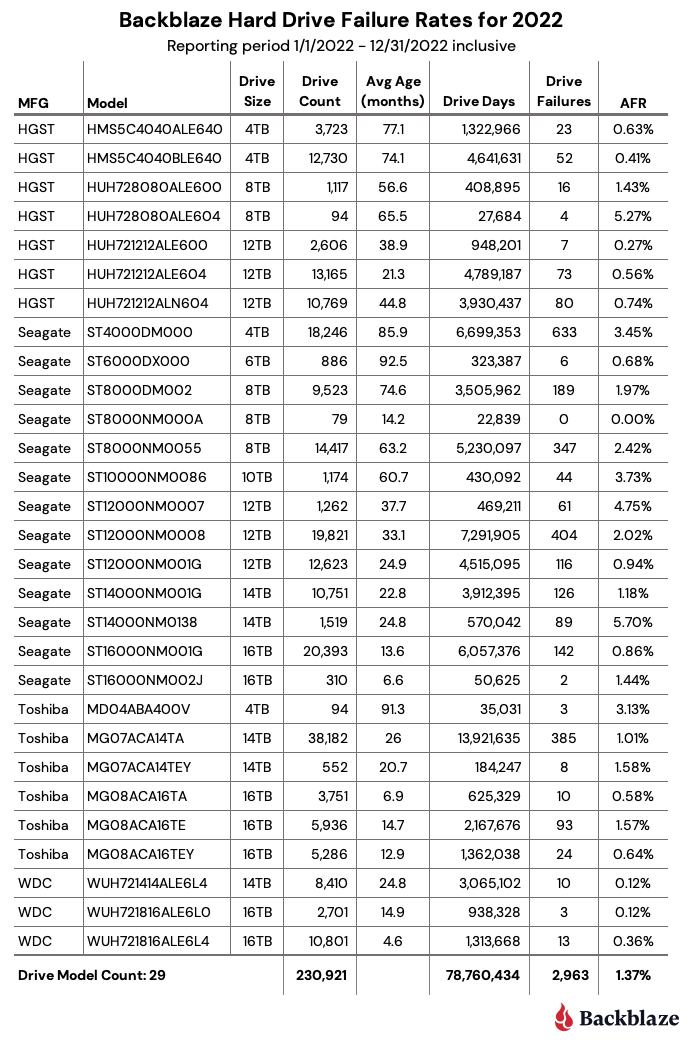
At the end of 2022, Backblaze was monitoring 231,309 hard drives used to store data. For our evaluation, we removed 388 drives from consideration which were used for either testing purposes or drive models for which we did not have at least 60 drives. This leaves us with 230,921 hard drives to analyze for this report.
Observations and Notes
One Zero for the Year
In 2022, only one drive had zero failures, the 8TB Seagate (model: ST8000NM000A). That “zero” does come with some caveats: We have only 79 drives in service and the drive has a limited number of drive days—22,839. These drives are used as spares to replace 8TB drives that have failed.
What About the Old Guys?
- The 6TB Seagate (model: ST6000DX000) drive is the oldest in our fleet with an average age of 92.5 months. In 2021, it had an annualized failure rate (AFR) of just 0.11%, but has slipped a bit to 0.68% for 2022. A very respectable number any time, but especially after nearly eight years of duty.
- The 4TB Toshiba (model: MD04ABA400V) drives have an average age of 91.3 months. In 2021, this drive has an AFR of 2.04% and that has jumped to 3.13% for 2022, which included three drive failures. Given the limited number of drives and drive days for this model, if there were only two drive failures in 2022, the AFR would be 2.08%, or nearly the same as 2021.
- Both of these drive models have a relatively small number of drive days, so confidence in the AFR numbers is debatable. That said, both drives have performed well over their lifespan.
New Models
In 2022, we added five new models while retiring zero, giving us a total of 29 different models we are tracking. Here are the five new models:
- HUH728080ALE604–8TB
- ST8000NM000A–8TB
- ST16000NM002J–16TB
- MG08ACA16TA–16TB
- WUH721816ALE6L4–16TB
The two 8TB drive models are being used to replace failed 8TB drives. The three 16TB drive models are additive to the inventory.
Comparing Drive Stats for 2020, 2021, and 2022
The chart below compares the AFR for each of the last three years. The data for each year is inclusive of that year only and the operational drive models present at the end of each year.
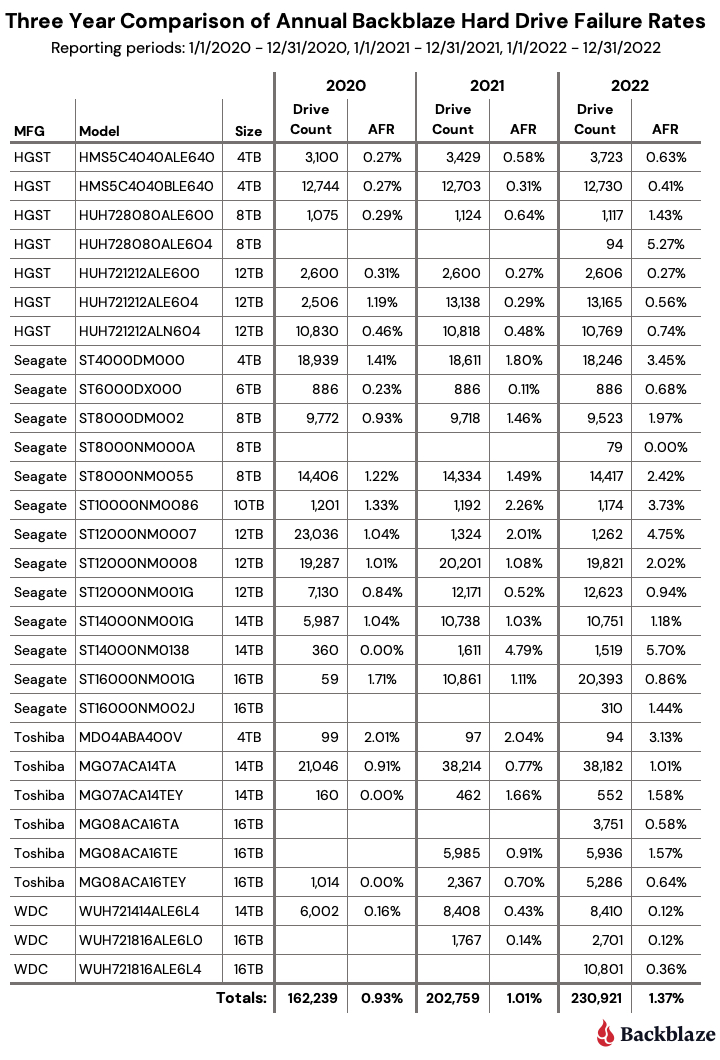
Drive Failure Was Up in 2022
After a slight increase in AFR from 2020 to 2021, there was a more notable increase in AFR in 2022 from 1.01% in 2021 to 1.37%. What happened? In our Q2 2022 and Q3 2022 quarterly Drive Stats reports, we noted an increase in the overall AFR from the previous quarter and attributed it to the aging fleet of drives. But, is that really the case? Let’s take a look at some of the factors at play that could cause the rise in AFR for 2022. We’ll start with drive size.
Drive Size and Drive Failure
The chart below compares 2021 and 2022 AFR for our large drives (which we’ve defined as 12TB, 14TB, and 16TB drives) to our smaller drives (which we’ve defined as 4TB, 6TB , 8TB, and 10TB drives).
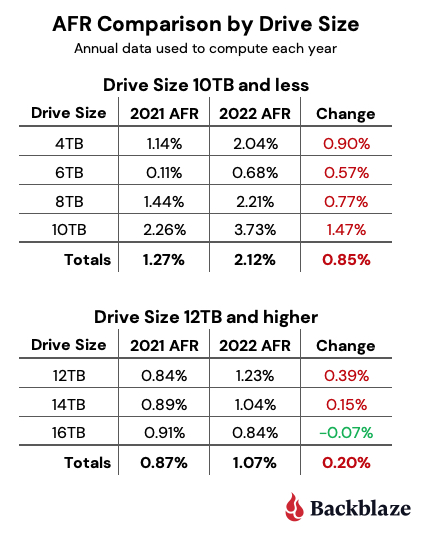
With the exception of the 16TB drives, every drive size had an increase in their AFR from 2021 to 2022. In the case of the small drives, the increase was pronounced, and at 2.12% is well above the 1.37% AFR for 2022 for all drives.
In addition, while the small drive cohort represents only 28.7% of the drive days in 2022, they account for 44.5% of the drive failures. Our smaller drives are failing more often, but they are also older, so let’s take a closer look at that.
Drive Age and Drive Failure
When examining the correlation of drive age to drive failure we should start with our previous look at the hard drive failure bathtub curve. There we concluded that drives generally fail more often as they age. To see if that matters here, we’ll start with the table below which shows the average age of each drive model of drives by size.
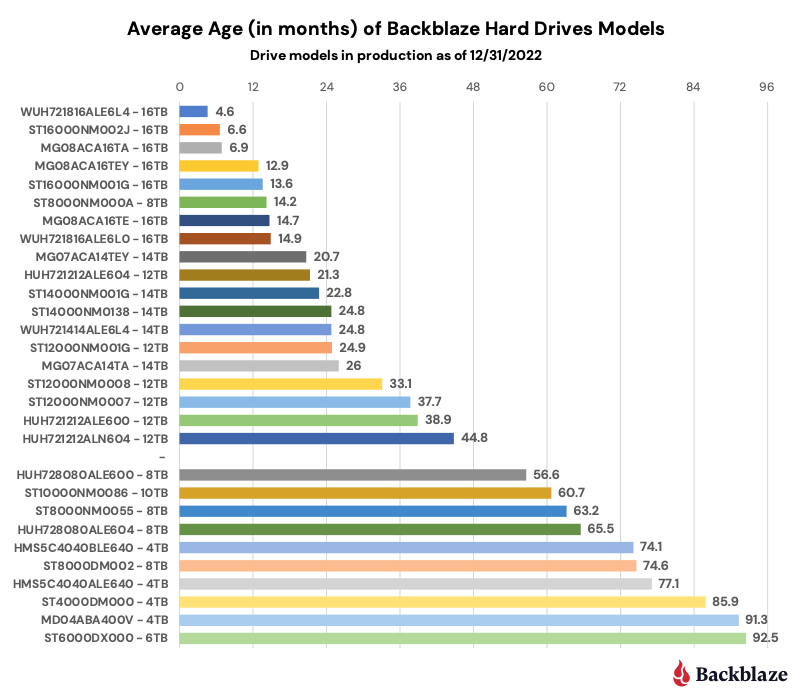
With the exception of the 8TB Seagate (model: ST8000NM000A), which we recently purchased as replacements for failed 8TB drives, the drives fall neatly into our two groups noted above—10TB and below and 12TB and up.
Now let’s group the individual drive models into cohorts defined by drive size. But before we do, we should remember that the 6TB and 10TB drive models have a relatively small number of drives and drive days in comparison to the remaining drive groups. In addition, the 6TB and 10TB drive cohorts consist of one drive model, while the other drive groups have at least four different drive models. Still, leaving them out seems incomplete, so we’ve included tables with and without the 6TB and 10TB drive cohorts.
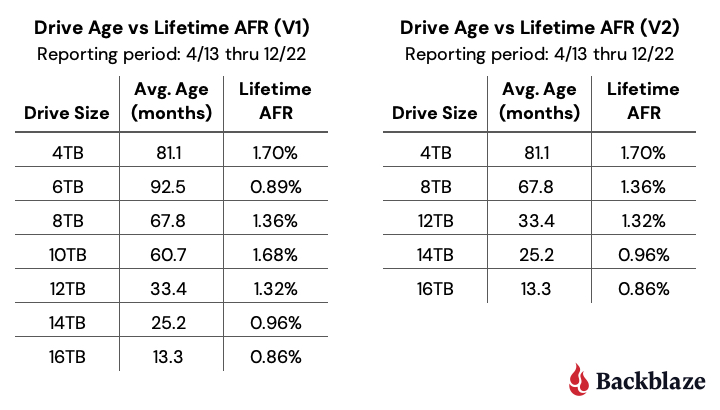
Each table shows the relationship for each drive size, between the average age of the drives and their associated AFR. The chart on the right (V2) clearly shows that the older drives, when grouped by size, fail more often. This increase as a drive model ages follows the bathtub curve we spoke of earlier.
So, What Caused the Increase in Drive Failure and Does it Matter?
The aging of our fleet of hard drives does appear to be the most logical reason for the increased AFR in 2022. We could dig in further, but that is probably moot at this point. You see, we spent 2022 building out our presence in two new data centers, the Nautilus facility in Stockton, California and the CoreSite facility in Reston, Virginia. In 2023, our focus is expected to be on replacing our older drives with 16TB and larger hard drives. The 4TB drives and yes, even our O.G. 6TB Seagate drives could go. We’ll keep you posted.
Drive Failures by Manufacturer
We’ve looked at drive failure by drive age and drive size, so it’s only right to look at drive failure by manufacturer. Below we have plotted the quarterly AFR over the last three years by manufacturer.
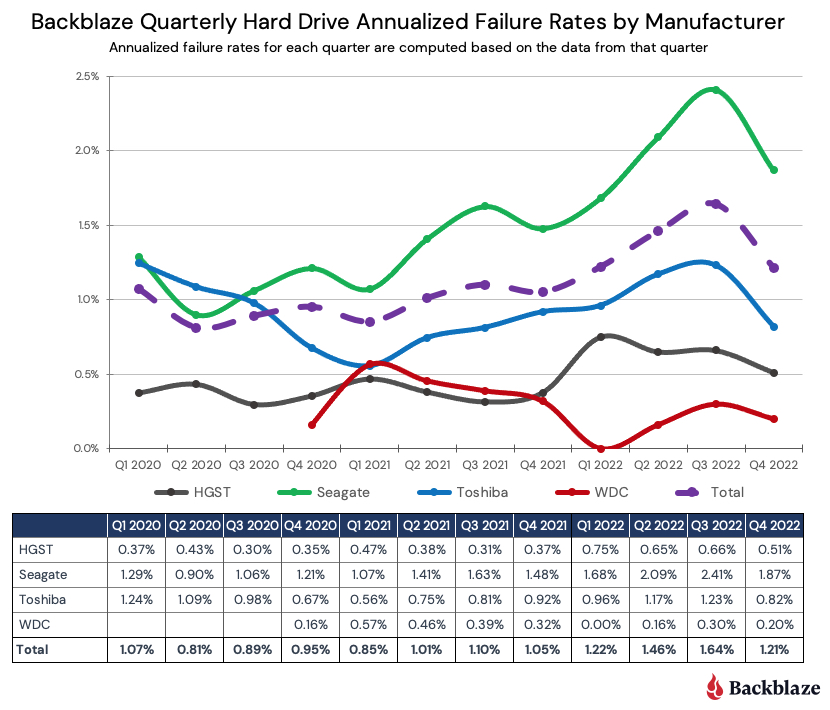
Starting in Q1 of 2021 and continuing to the end of 2022, we can see that the overall rise in the overall AFR over that time seems to be driven by Seagate and, to a lesser degree, Toshiba, although HGST contributes heavily to the Q1 2022 rise. In the case of Seagate, this makes sense as most of our Seagate drives are significantly older than any of the other manufacturers’ drives.
Before you throw your Seagate and Toshiba drives in the trash, you might want to consider the lifecycle cost of a given hard drive model versus its failure rate. We looked at this in our Q3 2022 Drive Stats report, and outlined the trade-offs between drive cost and failure rates. For example, in general, Seagate drives are less expensive and their failure rates are typically higher in our environment. But, their failure rates are typically not high enough to make them less cost effective over their lifetime. You could make a good case that for us, many Seagate drive models are just as cost effective as more expensive drives. It helps that our B2 Cloud Storage platform is built with drive failure in mind, but we’ll admit that fewer drive failures is never a bad thing.
Lifetime Hard Drive Stats
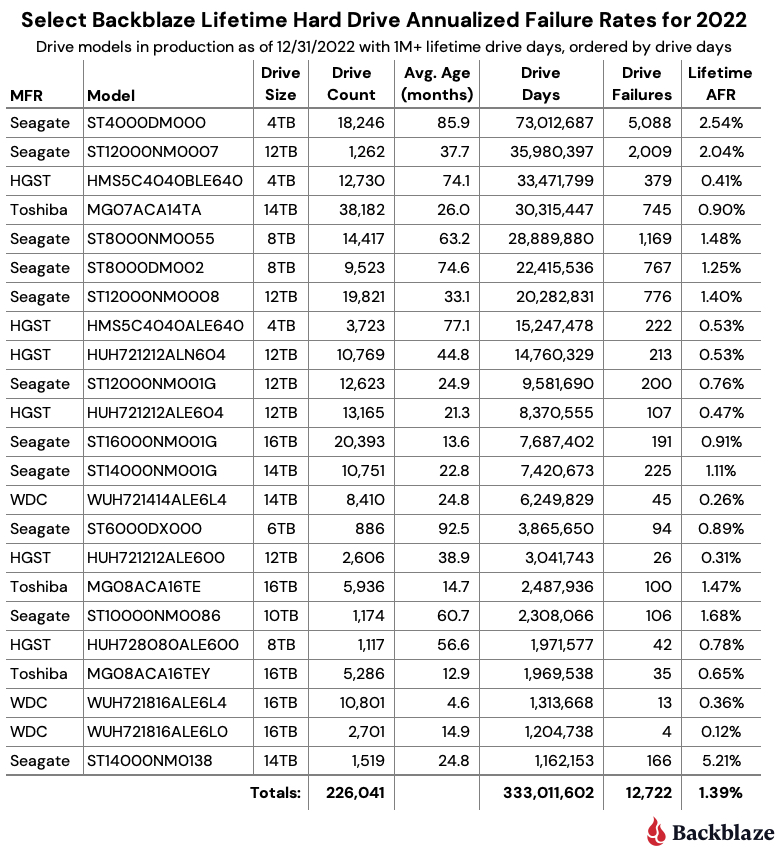
The table below is the lifetime AFR of all the drive models in production as of December 31, 2022.
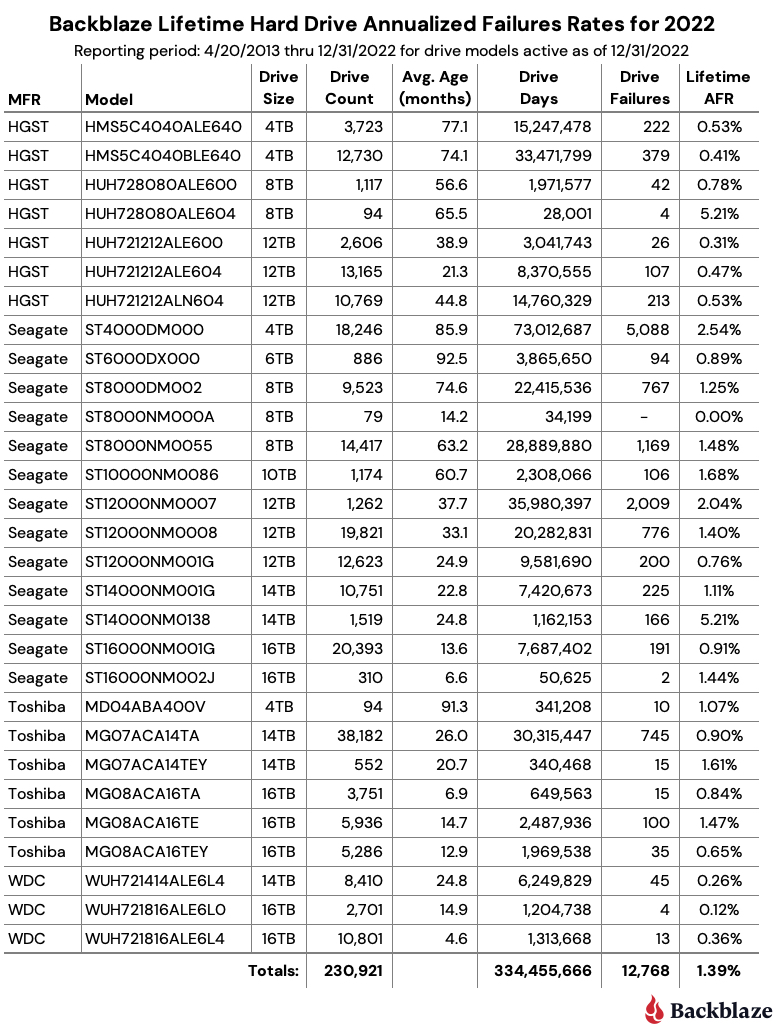
The current lifetime AFR is 1.39%, which is down from a year ago (1.40%) and also down from last quarter (1.41%). The lifetime AFR is less prone to rapid changes due to temporary fluctuations in drive failures and is a good indicator of a drive model’s AFR. But it takes a fair amount of observations (in our case, drive days) to be confident in that number. To that end, the table below shows only those drive models which have accumulated one million drive days or more in their lifetime. We’ve ordered the list by drive days.
Finally, we are going to open up a bit here and share the results of the 388 drives we removed from our analysis because they were test drives or drive models with 60 or fewer drives. These drives are divided amongst 20 different drive models and the table below lists those drive models which were operational in our data centers as of December 31, 2022. Big caveat here: these are just test drives and so on, so be gentle. We usually ignore them in the reports, so this is their chance to shine, or not. We look forward to seeing your comments.
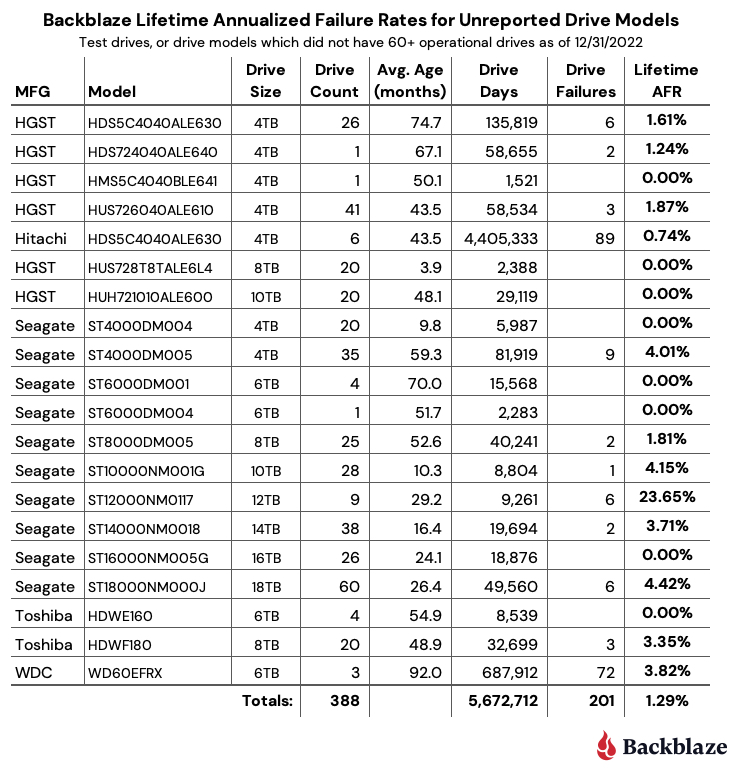
There are many reasons why these drives got to this point in their Backblaze career, but we’ll save those stories for another time. At this point, we’re just sharing to be forthright about the data, but there are certainly tales to be told. Stay tuned.
Our Annual Drive Stats Webinar
Join me on Tuesday, February 7 at 10 a.m. PT to review the results of the 2022 report. You’ll get a look behind the scenes at the data and the process we use to create the annual report.

The Hard Drive Stats Data
The complete data set used to create the tables and charts in this report is available on our Hard Drive Test Data page. You can download and use this data for free for your own purpose. All we ask are three things: 1) you cite Backblaze as the source if you use the data, 2) you accept that you are solely responsible for how you use the data, and 3) you do not sell this data itself to anyone; it is free.
If you just want the data used to create the tables and charts in this blog post you can download the ZIP file containing the CSV files for each chart.
Good luck and let us know if you find anything interesting.
Want More Insights?
Check out our take on Hard Drive Cost per Gigabyte and Hard Drive Life Expectancy.
Interested in the SSD Data?
Read the most recent SSD edition of our Drive Stats Report.