Cloud performance is easy to claim and hard to measure. As data volumes grow and workloads become more complex, the real question isn’t just how fast a provider is—it’s how that performance holds up in practice, and what you’re actually getting for what you pay.
Our answer to that challenge is Performance Stats, the most recent addition to our Stats franchises, Drive Stats and Network Stats. This ongoing, quarterly report will share performance testing results for both Backblaze and competitors, as well as the testing methodology so that anyone can recreate, compare results, and contribute to building better tests if necessary. (And, as always, we love the healthy debate in the comments section and beyond.)
By sharing the full results—strengths, limitations, anomalies, and more—we’re working to give developers and teams a more complete picture of how cloud storage providers perform in practice. We’re building a dataset over time, and we’re just at the beginning—let’s dive in.
And we can talk about it, too
Join the Performance Stats team on Thursday, April 9, 2026 to go over the stats, talk about testing methodology, and more. Have a question for us? Submit your question ahead of time here.
Q1 2026: The results
We ran performance testing for Backblaze B2, AWS S3, Cloudflare R2, and Wasabi Object Storage in two regions, US-East and the EU-Central. Our EU data center is in Amsterdam, and just like in our first round of testing, we matched the other cloud provider locations as closely as possible. You can jump to the testing methodology if you’d like more details.
Key findings:
- Average upload and download times for US-East improved across nearly all providers and file sizes compared to Q4 2025. Backblaze led in upload averages for 256KiB and 5MiB files, with Wasabi taking the 2MiB category.
- Sustained throughput testing continues to tell a different story than averages alone. As with last quarter, the spread between highest and lowest values per file size remains wide—particularly in multi-threaded tests, where providers’ architectural choices show up most clearly.
- EU-Central results show meaningful regional variation. Provider rankings shifted between US-East and EU-Central—for example, Cloudflare R2 performed notably well on EU upload and download averages, while Wasabi led in several EU upload throughput categories. The takeaway: geography matters, and no single provider’s US performance predicts their EU performance.
- Multi-threaded download tends to see a sharp rate of increase and then level out. In both US-East and the EU and for most of the tested providers, we see a sharp increase in mebibytes per second performance from the 256KiB to 5MiB file size, then a relatively flat trendline thereafter. This is an early trend that has existed quarter-on-quarter, and worth watching over time.
And, here’s a roadmap if you want to quickly reach each test:
A reminder of why we’re doing this
We want to cut through the noise on cloud performance, and we’re working to build a transparent dataset to support that. This transparency is also why we’re publishing our testing methodology.
We want to take a hard look at performance on a level playing field for two reasons:
- Buyers should know what they’re getting and have the tools to sniff out the hype and misleading messaging many providers peddle about their performance.
- If we don’t measure ourselves, we won’t get better. We want you to understand where we’re doing well today, and we want to take you along for the ride as we work to improve where we’re not.
We’ve outlined the methodology at the end of this report. And, across the board, it’s important to note that this project is still young. Young datasets have lots of variability before they show true patterns: So, the best way to understand these results is to re-create them yourselves within your own tech stack.
On the subject of transparency, let’s talk rate limits
From the start, we expected the data to surface both strengths and weaknesses, which is why transparency has to include context—not just raw results. This time around, the thing that was revealed is our rate limits.
At a certain level of scale, cloud storage providers have to implement rate limits to ensure consistent performance and keep the platform secure from intentional or unintentional volumetric attacks. And, we even saw an example of that behavior last quarter in the Wasabi data—in that case, the limit they have in place is that they don’t allow users to run HTTP requests for the first 30 days of a new account period.
Our rate limits work differently. I’m simplifying a bit, but there are three different ways you can trigger a rate limit: too much bandwidth being pushed, too many requests per second, or too many threads running concurrently. On the user’s side, you see either a 429 error (if you’re running our B2 Native API) or a 503 error (if you’re running the S3 compatible API).
We didn’t hit rate limits in all tests. In fact, we only hit them in the multi-threaded throughput tests at the larger file sizes, which indicated to us that we were running into bandwidth caps. And, since throughput testing by nature is a stress test, this is relatively unsurprising. We’re trying to push as much data as possible in a five minute period—if the platform doesn’t know testing is happening, it can look like a volumetric attack.
Now to the sticky part from a reporting perspective: When we set out to write this report, the testing methodology includes the parameter that we’d test standard account tiers. In practice, we actually have no control over whether our testing accounts are being treated differently on the back-end with other providers, for better (preferential treatment) or worse (throttling). That’s also why we run testing from an independent Vultr server—it means we aren’t using a Backblaze-owned IP address, so the testing account isn’t identifiable by other providers. The accounts are being judged on their behavior.
So what do we do here? How do we balance testing against real world behavior? We decided to show you what it looks like when you hit rate limits and outline some potential steps for user-side mitigation.
On every cloud storage platform, we can expect that there are default rate limits applied. When we saw our own, we had the advantage of knowing that that’s what we were seeing—if we were in the real world, we’d do additional investigation to confirm. From a testing perspective, we went forward in a way that would be the most likely scenario in the real world: We incorporated an auto-retry script.
In all cases for this report, we were hitting bandwidth caps at the larger file sizes in the multi-threaded throughput tests. So, if the test tried and failed, we raised that limit and only that limit—all other account parameters stayed in line with the default standard account. In the real world, you would have completed your investigation, then reached out to Support to raise bandwidth caps, which would then apply to your account going forward.
There are actions you can take before requesting a change, especially because sometimes API calls are failing for other reasons. So it’s helpful to do things like retry with exponential backoff, double check your lifecycle rules and other automated processes (especially sequential operations), increase or decrease thread count, change file size, etc., and keep all the logs, too. Sometimes just those things will solve the issues you need to solve.
More importantly, all of those actions are things that will give you more information about what type of configuration issues you’re having, and, if you are running into a rate limit issue, (at least with us) you can request a specific configuration change. For example, in this case, we only raised the bandwidth cap, and kept all the other account configuration variables in line with our standard tier. Our concern was to keep the testing as fair and consistent as possible. But, in a real-world scenario, that may mean you’d avoid something like jumping into a different pricing tier. In all cases and with all providers, testing and communication are key at this stage. Data, as always, is king.
Back to this report: we have two important impacts. First, we can’t confidently make quarter over quarter comparisons this time around because we’ve changed the testing methodology (though we can do so in our upload and download averages, as they weren’t affected). We may point out observational patterns, but we can’t say they’re significant. And hey, the dataset is young—we shouldn’t be doing that yet anyway. Second, if we hit a rate limit, we went ahead and included that data as a separate line item in our tables—so I’ve updated our testing methodology accordingly.
With that out of the way, let’s get into the report.
US-East
This quarter, we’ve added a second region to our reporting. We’ll start with US-East, then move to EU-Central.
Upload comparisons
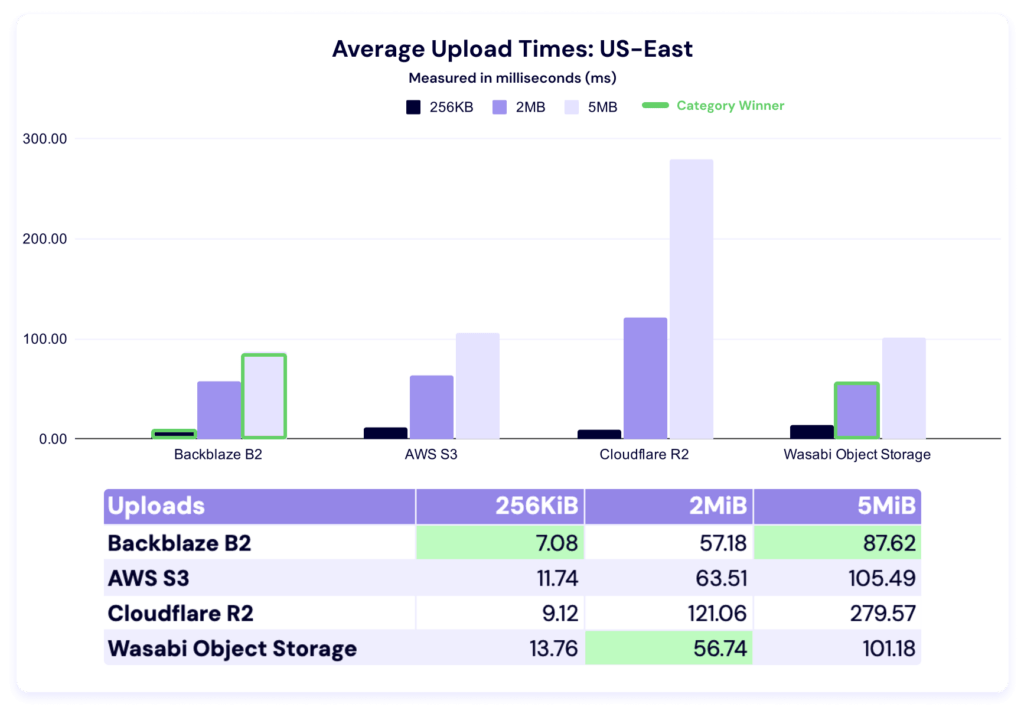
This test shows the average time in milliseconds it takes to upload a file. Averages were taken across a month of data and for three different file sizes.
In these tests, a lower result is better, and as with the last report, we’ve highlighted the category winners in green for readability.
We’ve got a young dataset here, so it’s hard to attribute significance this early, but let’s look at a quarter-over-quarter comparison. (Note: We did not have data from Wasabi last quarter.)
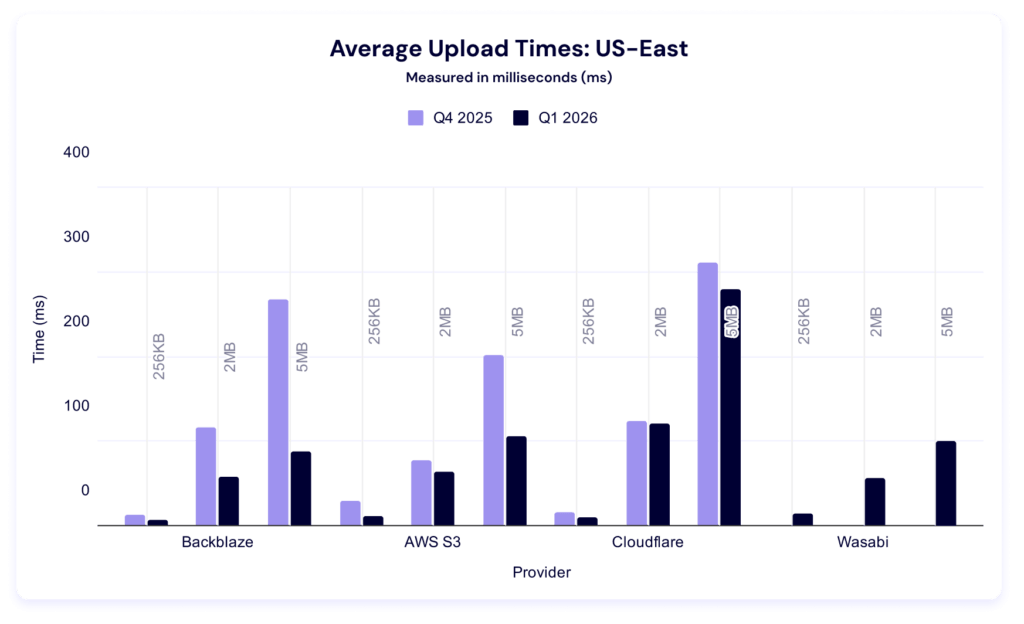
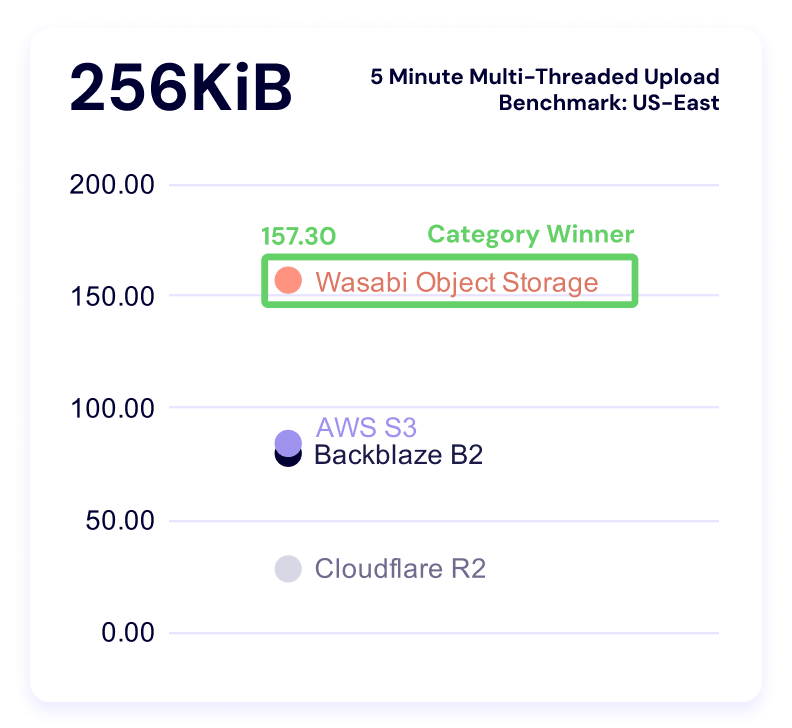
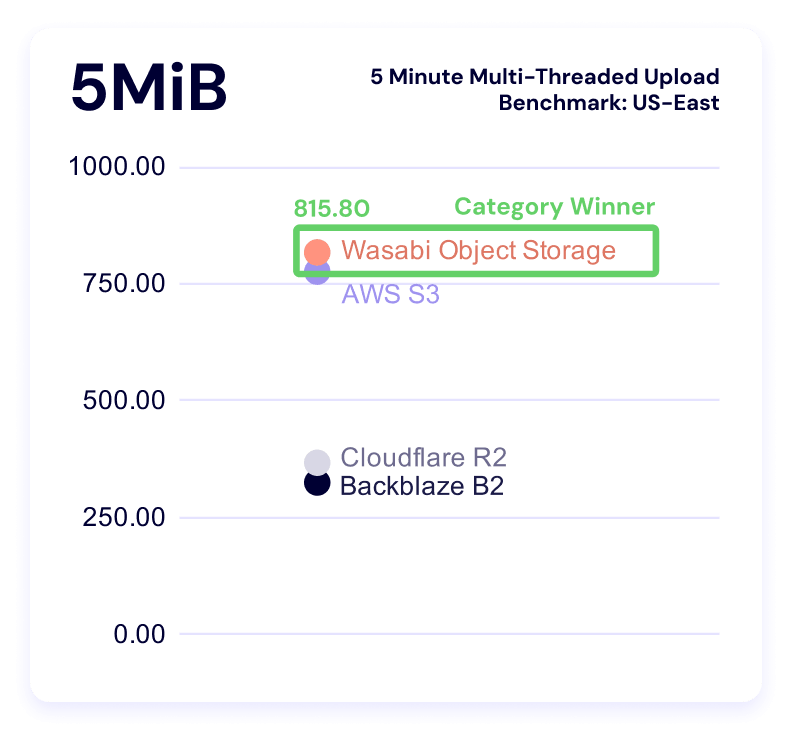
Interestingly, every provider had lower average upload times. Once again, Backblaze wins for 256KiB files. Last quarter, AWS led in the other two file sizes, but this quarter, Wasabi took over in the 2MiB category and Backblaze in the 5MiB.
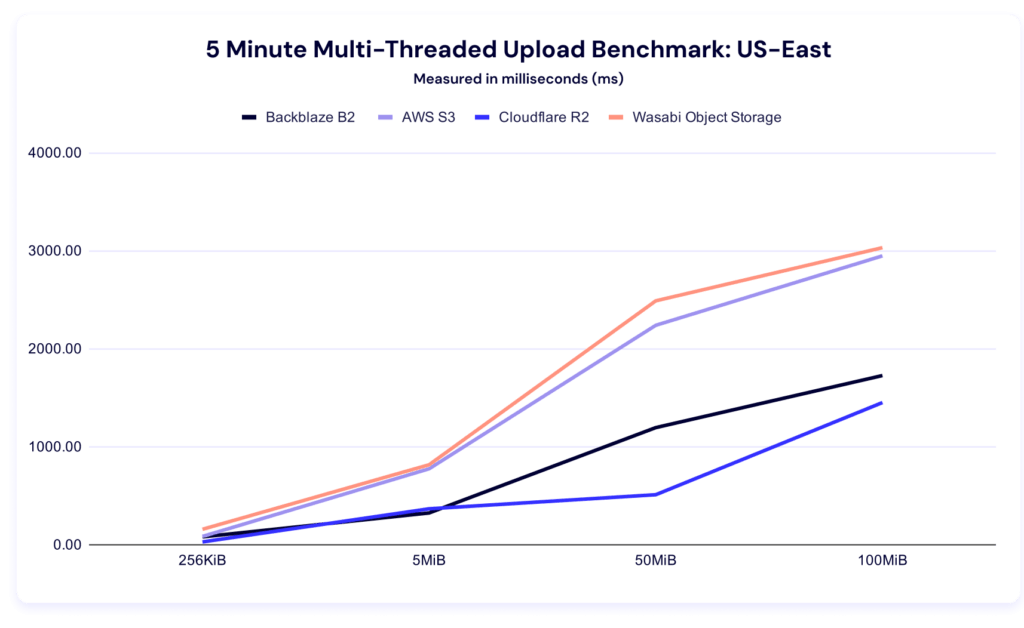
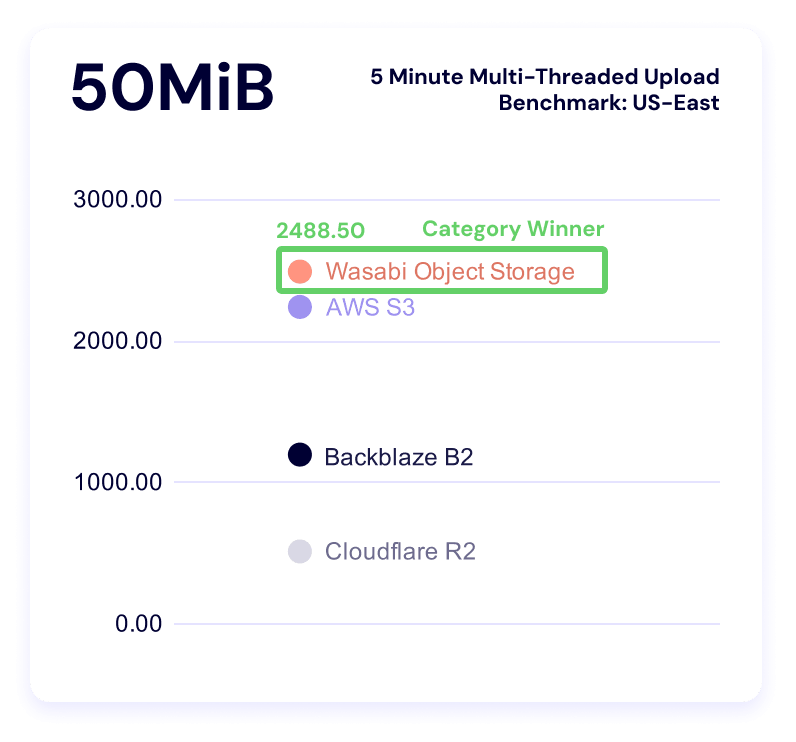
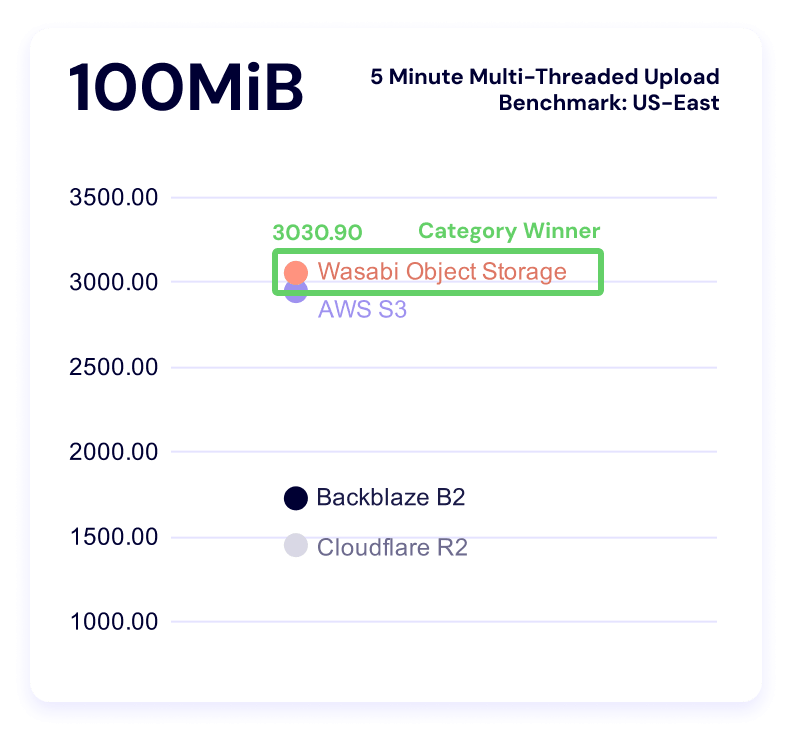
Five minute multi-threaded upload benchmark
In these tests, a higher result is better, as the result represents more average data being pushed in the five minute time period. This gives us quite a bit more information than just average upload time for a single file—it tells us the sustained amount of data you can push to a cloud storage provider in five minutes. This is also where we see our first rate limit in action.
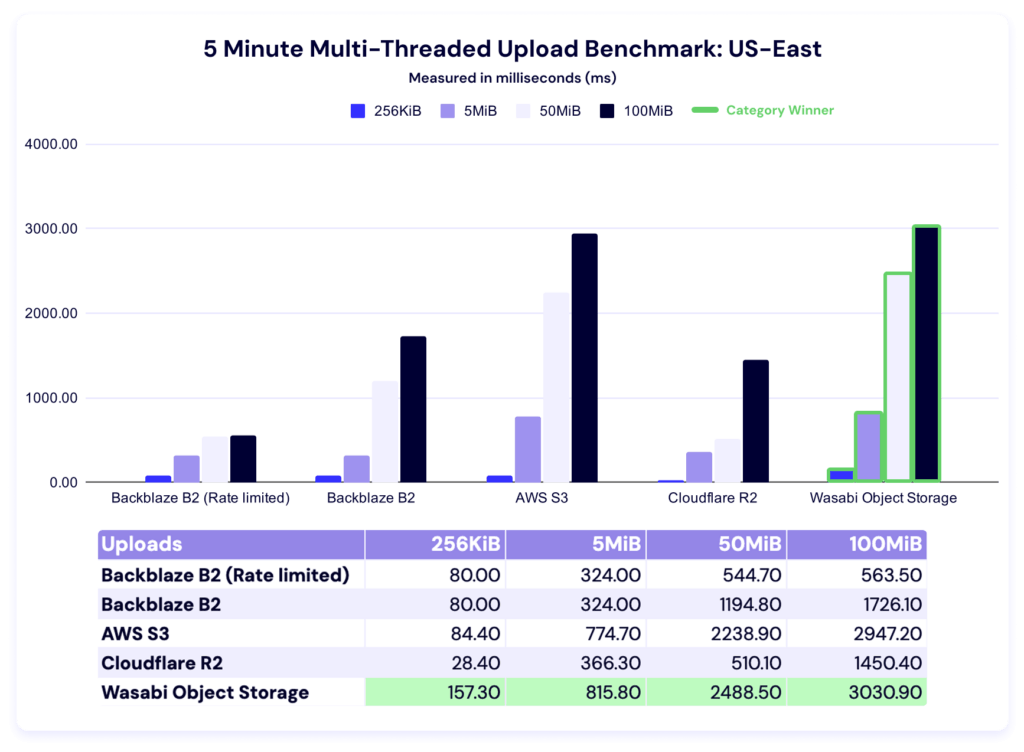
You’ll notice that the first two values for the rate limited and un-rate limited account are the same—which makes sense, because they hadn’t triggered the bandwidth cap. In the rate-limited version, the values in the higher file sizes are suspiciously similar. We had the benefit of knowing we were hitting our own rate limits, but if you were doing external testing, you’d go through the things we talked about above. Different providers have different policies on what they can and can’t allow, so check out each platform’s documentation for clarity.
As for the rest of the data: Wasabi sweeps this category. As our dataset grows over time, we’ll have more of an ability to say what’s “normal.” And, as always, your use case comes into play here—there’s a difference between baseline averages and what you can tolerate within your workflows, and when you’re making business decisions, the latter is where you find real value. Trade-offs are strategy.
While we can’t perfectly compare quarter-on-quarter because of the methodology change, it’s interesting to note that we still have a wide variance between our highest and our lowest values per file size category in this test type, which is in line with what we saw last quarter. If that pattern continues in future quarterly datasets, we should make sure we take it into account when interpreting outliers.
Now let’s bring forward our alternative visualizations with the rate of increase:
And check in on clustering within the file sizes:
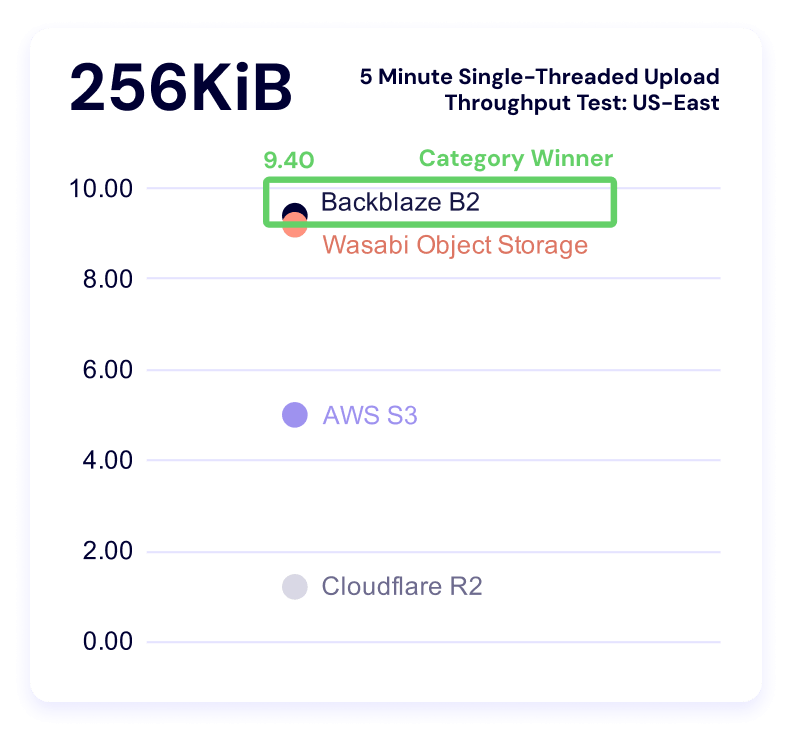
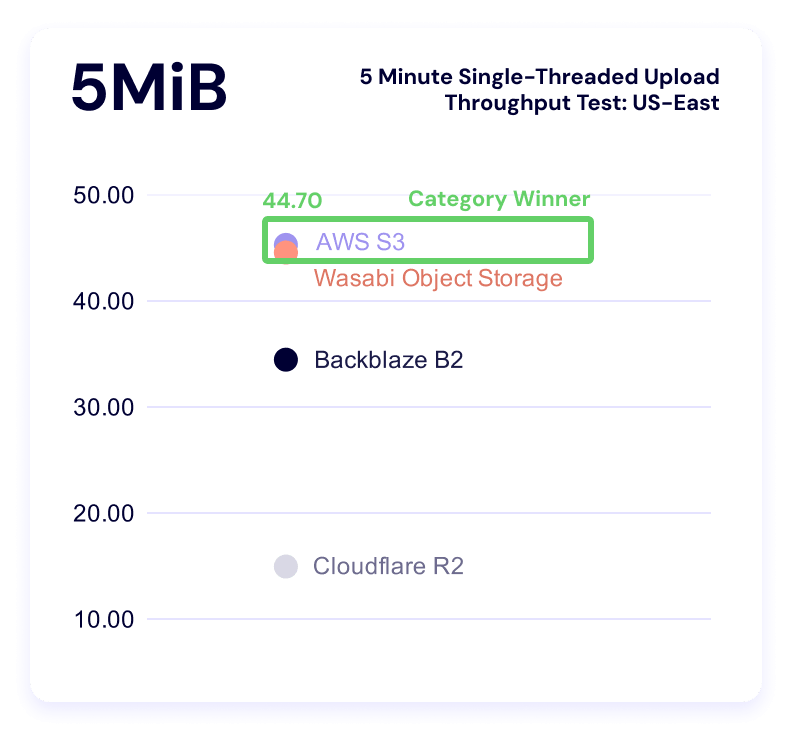
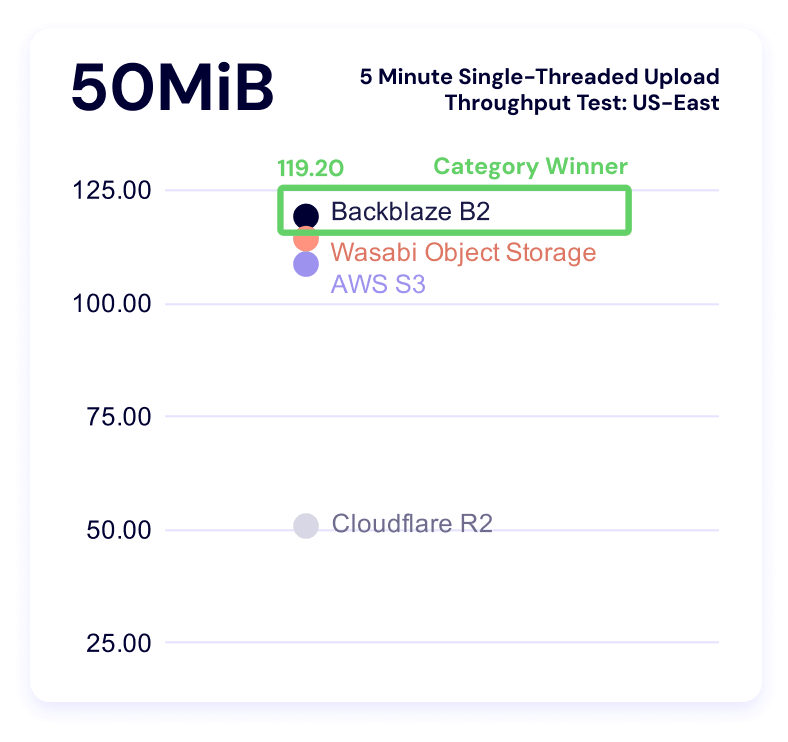
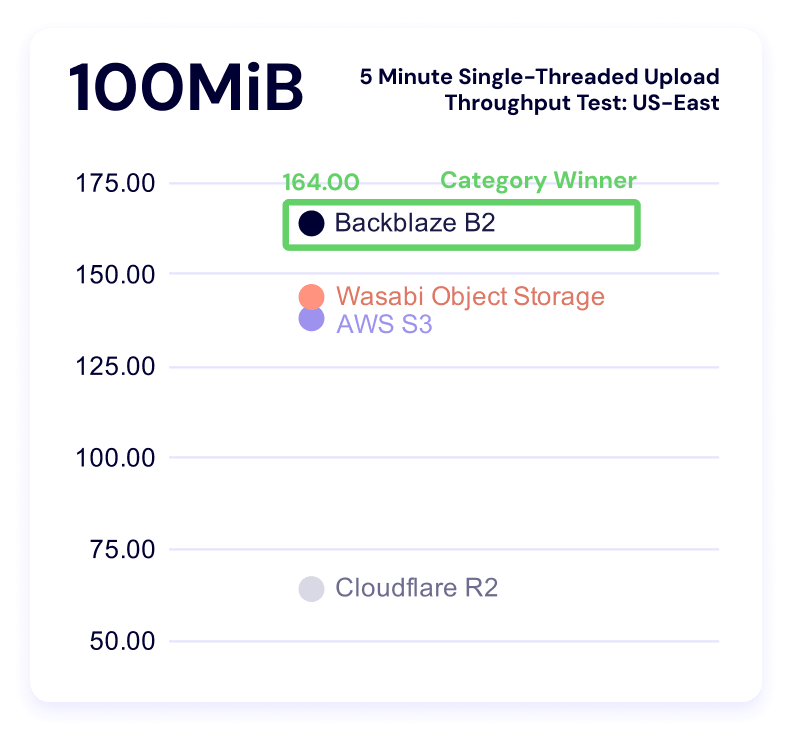
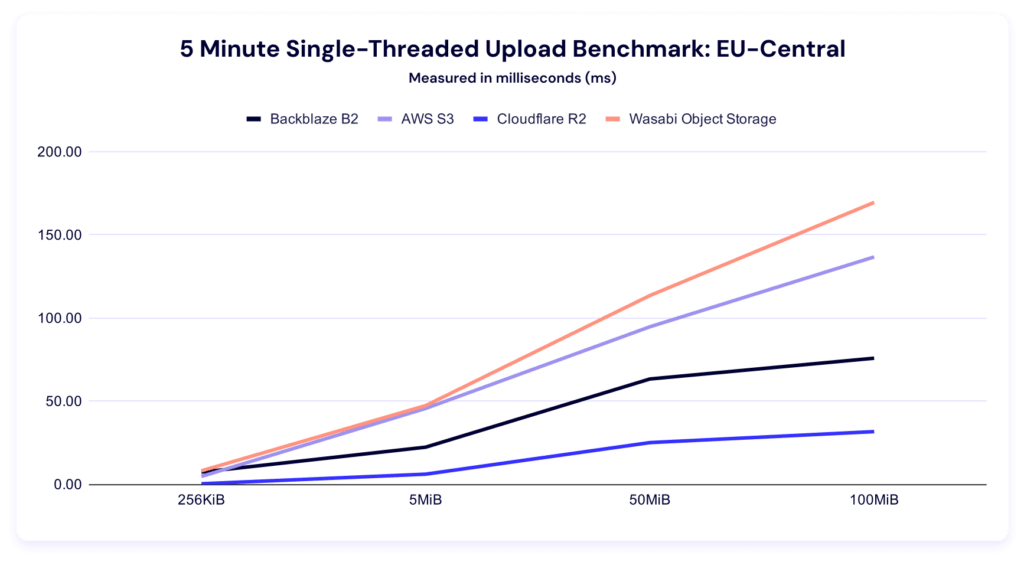
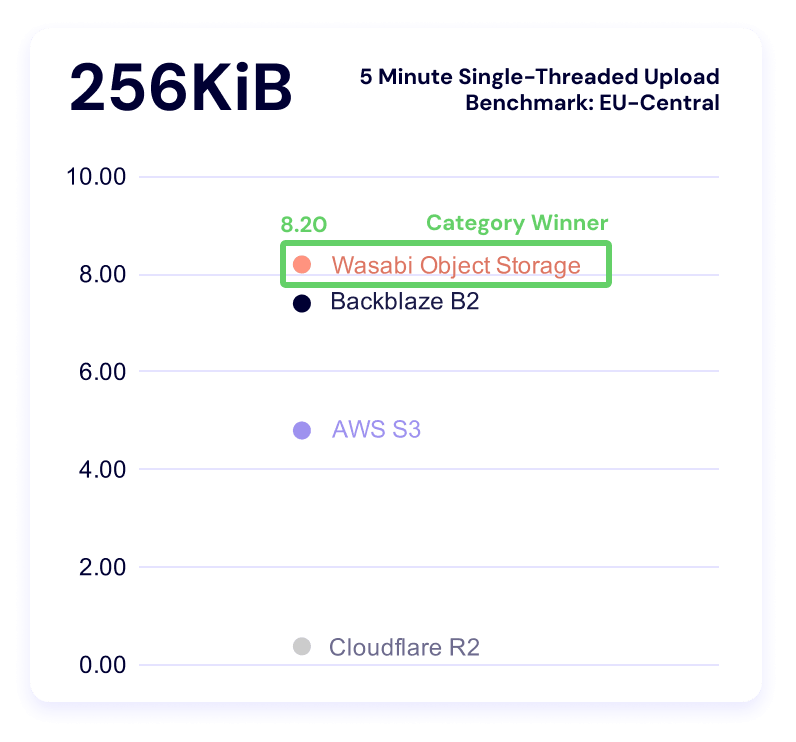
Five minute single threaded upload test
Once again, higher is better in this result, and it measures the sustained amount of data you can push to a server in a single thread with different file sizes.
Multi-threaded tests reveal what happens when you parallelize workload or data transfer whereas a single-threaded test measures how efficiently a provider handles one request. So, from our perspective, single threaded operations show us how a provider handles overhead including connection setup (handshake), request routing, waiting for the first byte, and then actual data transfer. It matters when APIs are making sequential calls or you have latency-sensitive or small-object workloads.
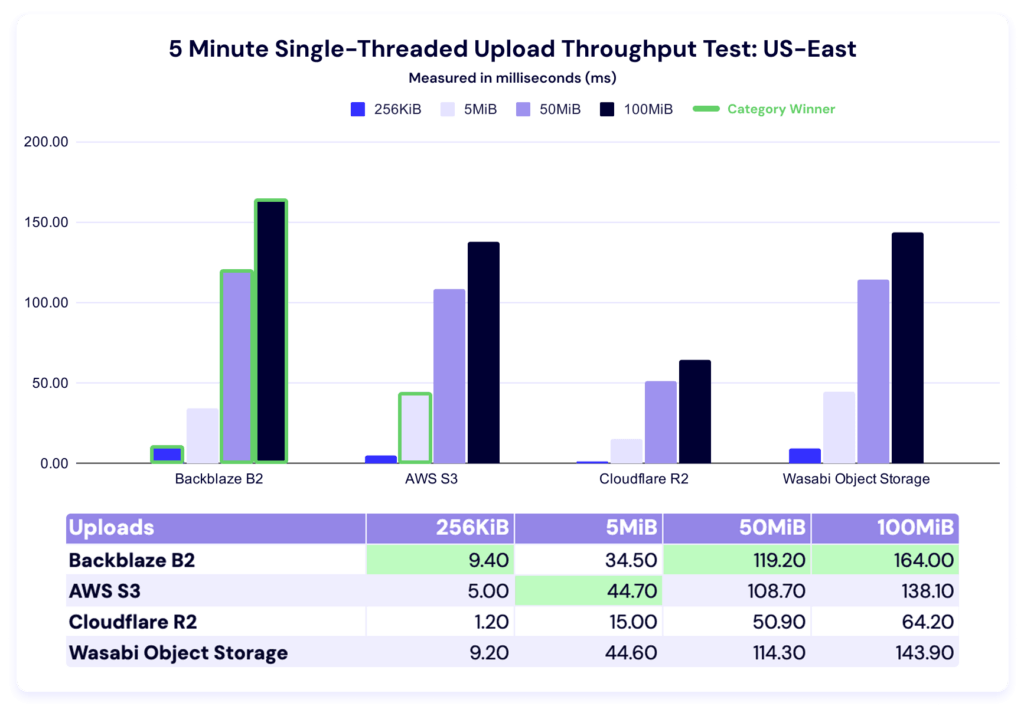
In this test, Backblaze leads in the 256KiB, 50MiB, and 100MiB categories, and AWS leads in the 5MiB category. Here’s our line graph:
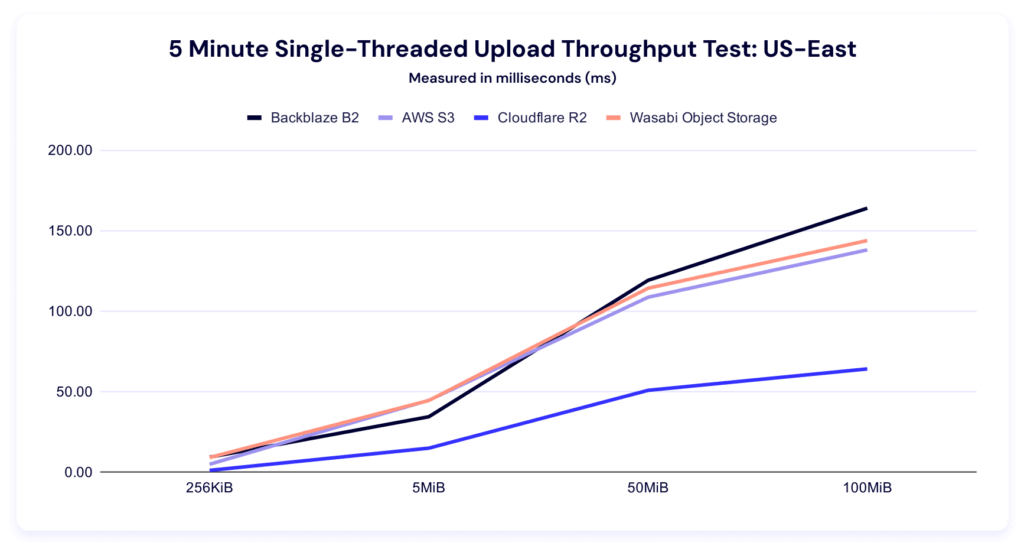
And, like the multithreading results, we see a high degree of variance between our highest and lowest results, which becomes even more apparent in our clustered view:
Download comparisons and TTFB
As with our upload average data, lower is better. This test measures how long it takes a single file to download, on average.
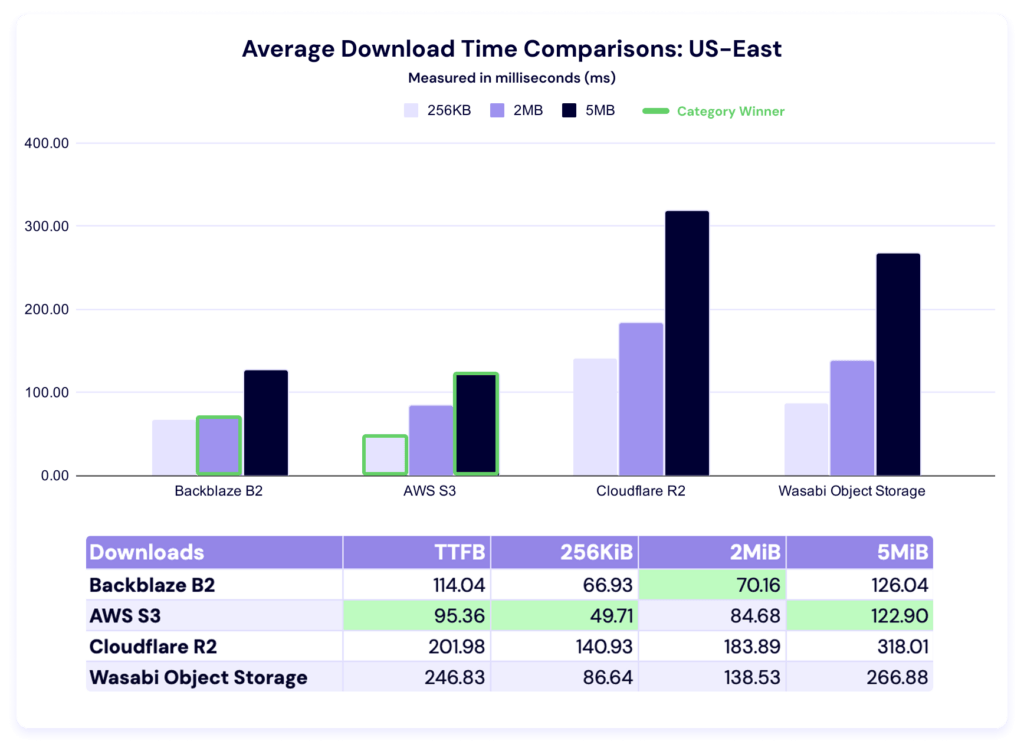
Last quarter, AWS led in all file sizes. This quarter, Backblaze overtakes in the 2MiB category, while Amazon S3 still leads in time to first byte (TTFB) as well as the 256KiB and 5MiB file sizes. Let’s zoom in on time to first byte (TTFB).
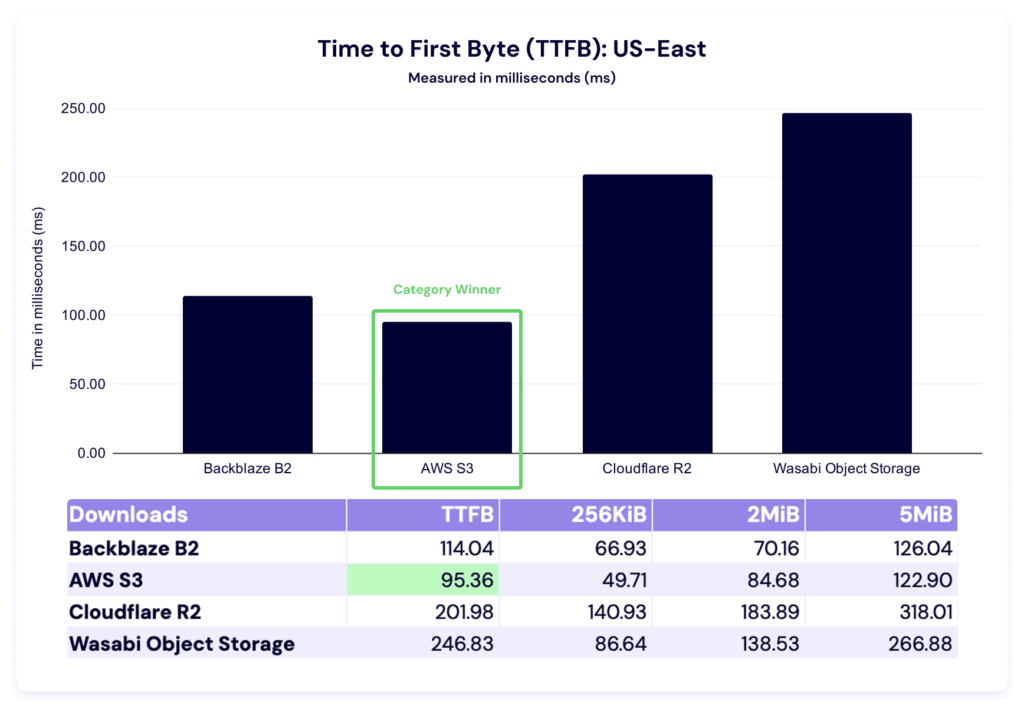
And take a look at our QoQ comparison:
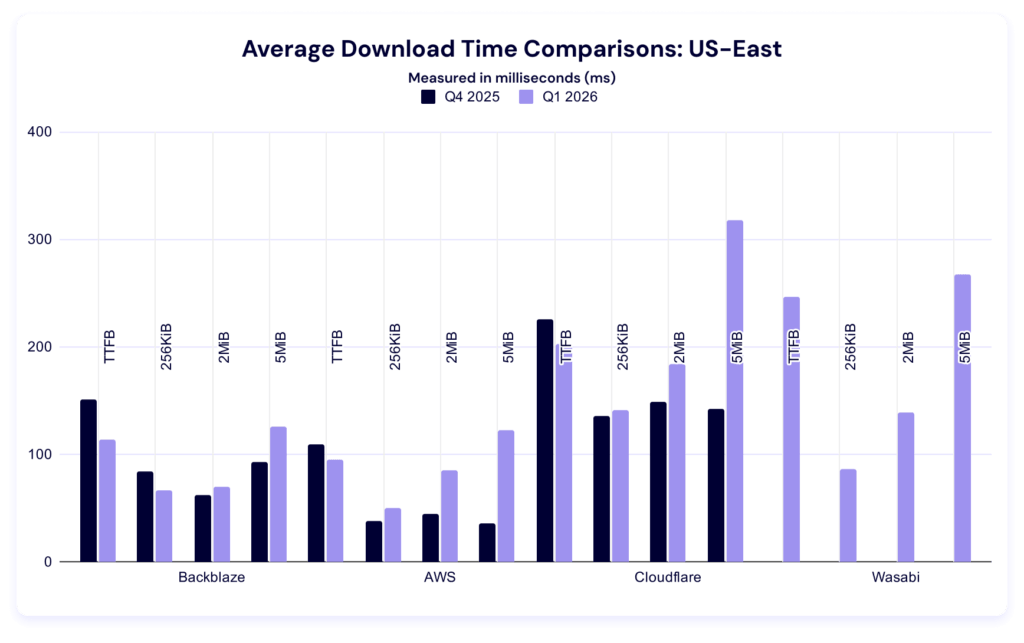
Again, our dataset is too young to determine the significance of changes within each category. Observationally, it’s interesting to note that most of these numbers improved.
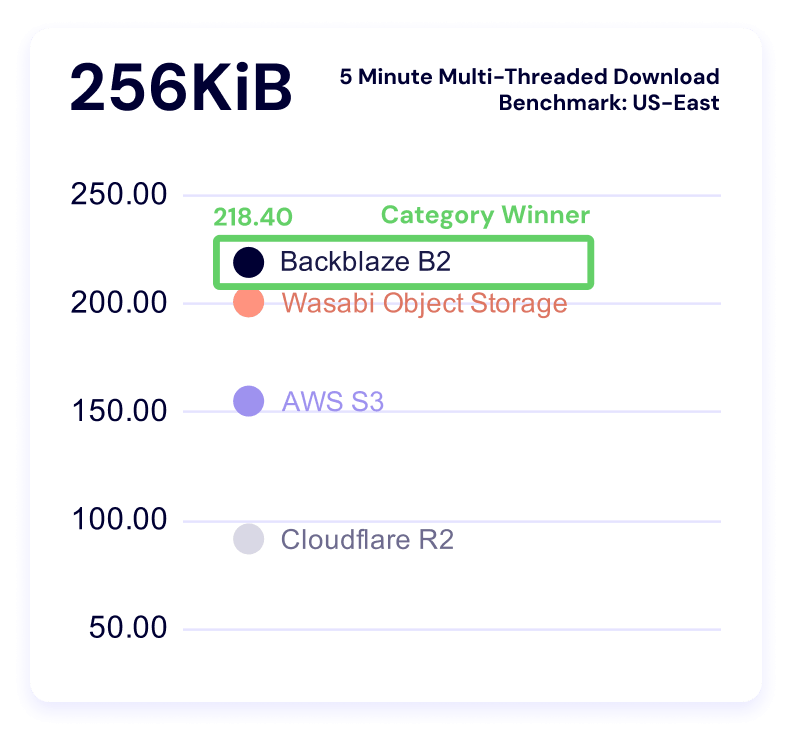
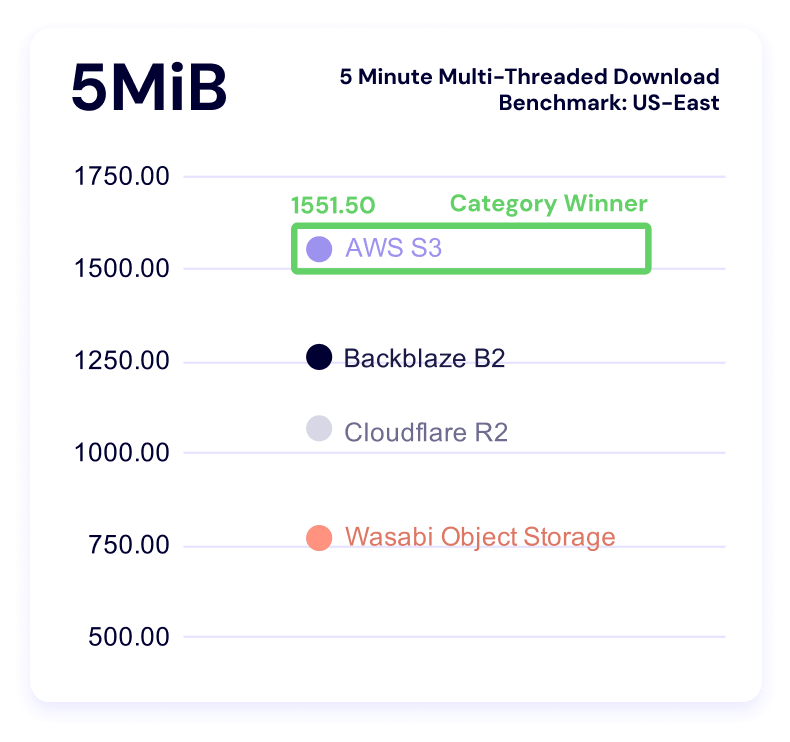
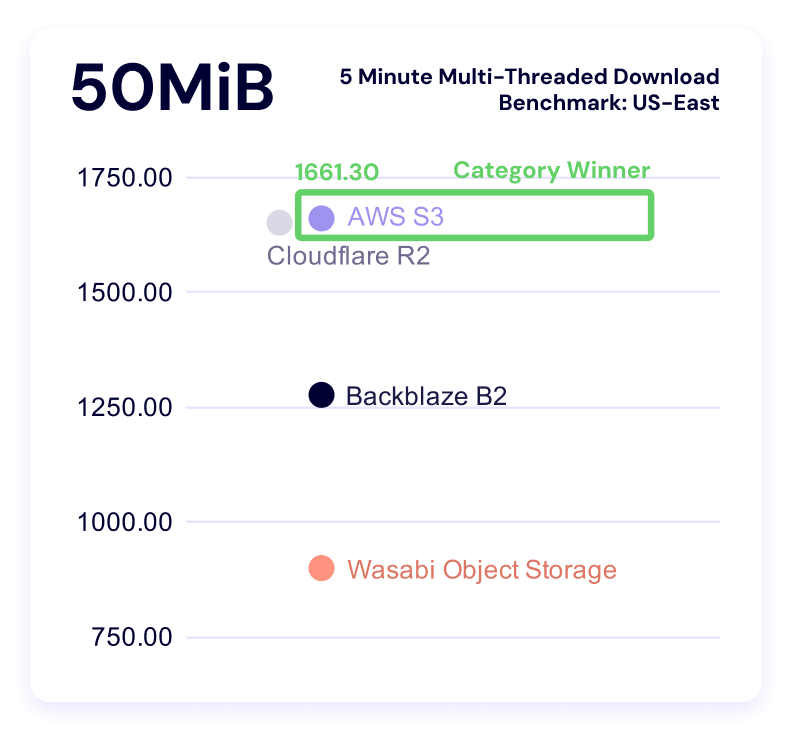
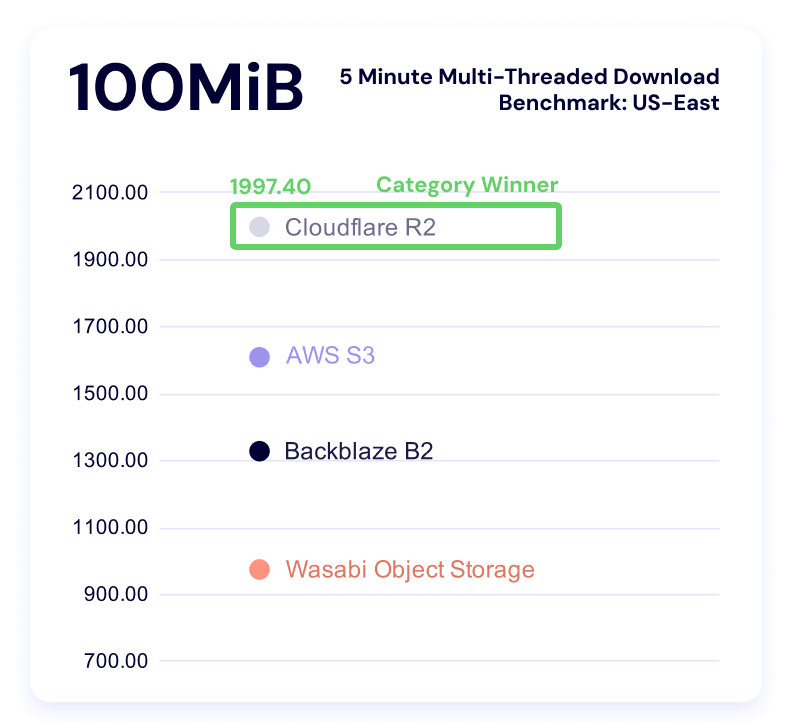
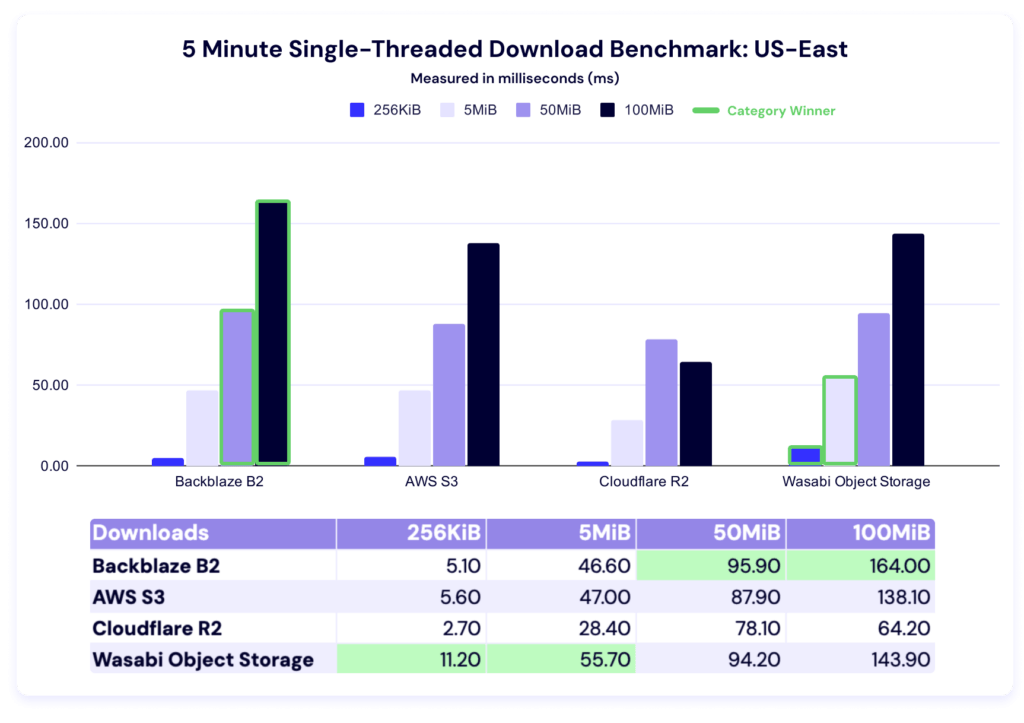
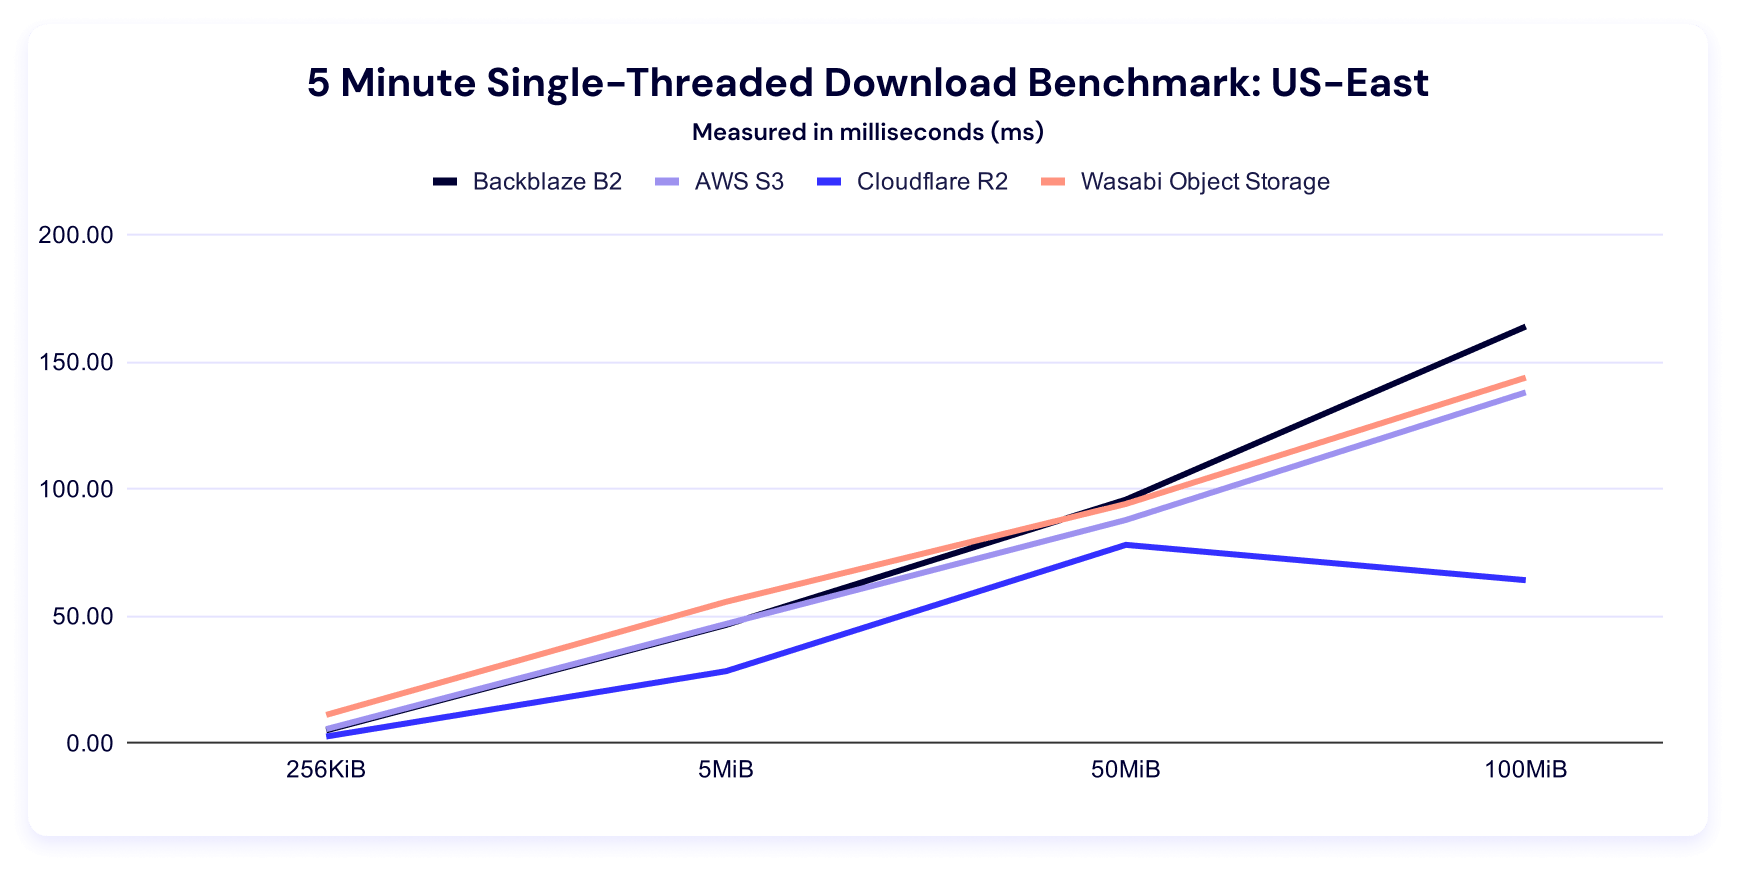
Five minute multi-threaded download benchmark
In these tests, a higher result is better, as the result represents more average data being downloaded in the five minute time period. And, as above, we can see Backblaze rate limits in the data.
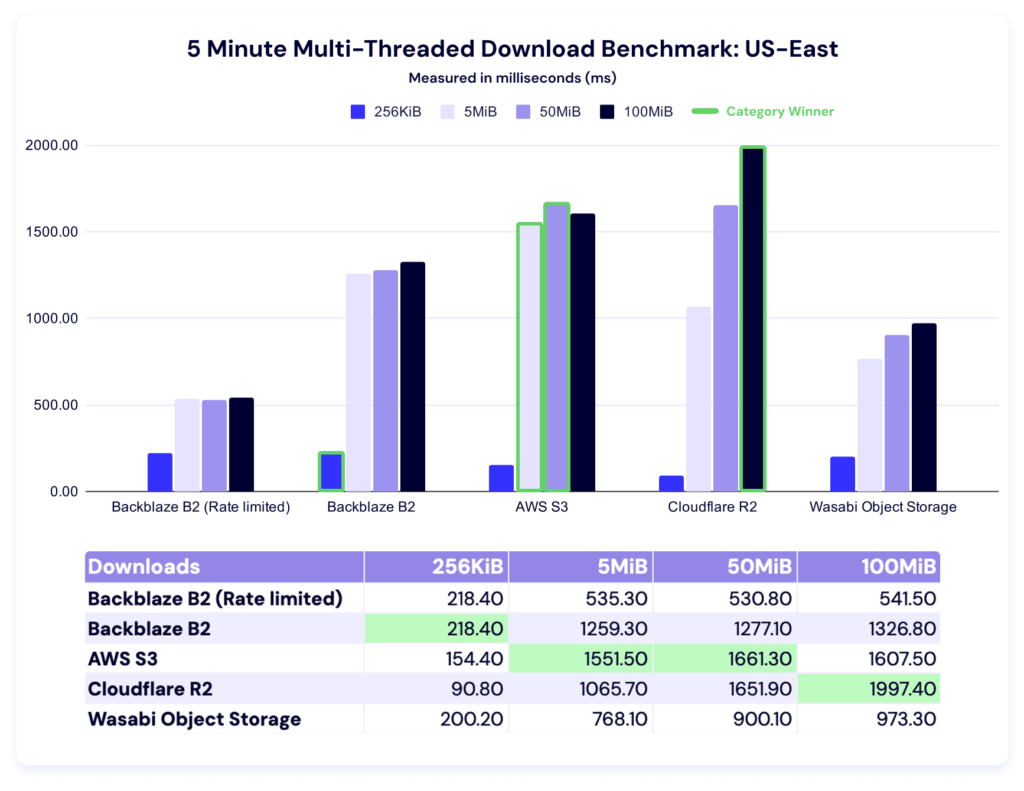
Backblaze leads for 256KiB files, AWS for 5MiB and 50MiB files, and Cloudflare for 100MiB files.
Let’s give ourselves the same charts as our upload tests. Here’s the trendline:
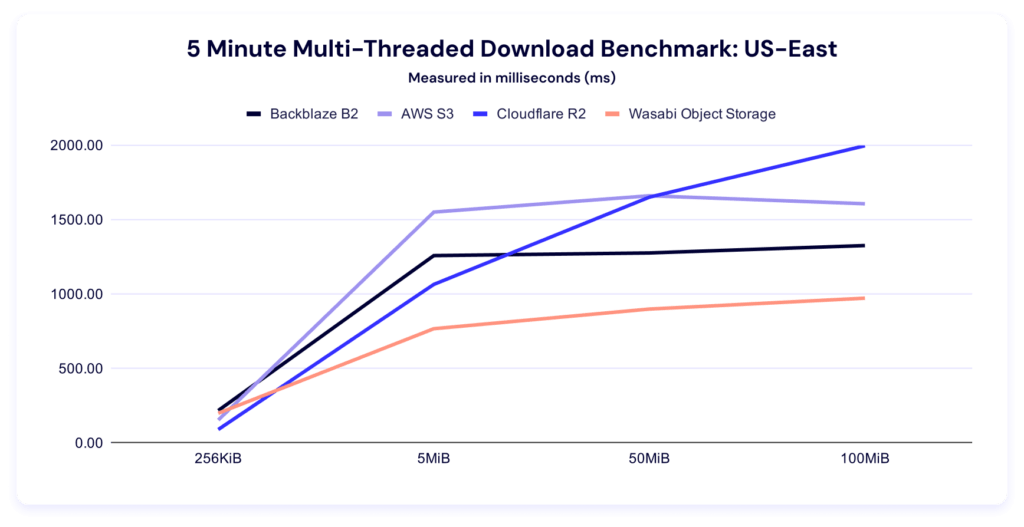
This chart makes clear how comparatively well Cloudflare R2 does at the larger file sizes—and as their core business is CDN, that makes a lot of strategic sense.
Here’s the per-file size clustering:
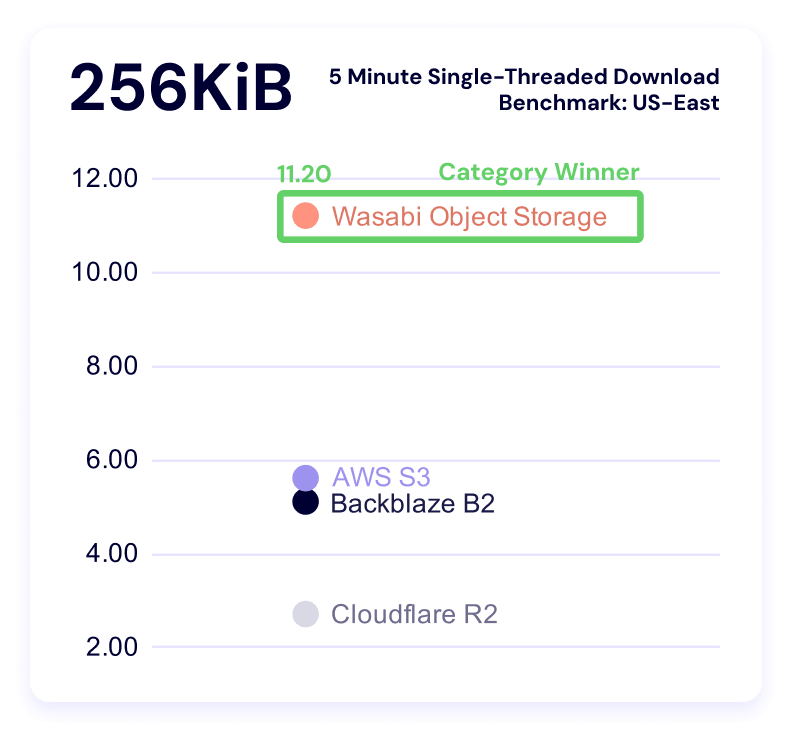
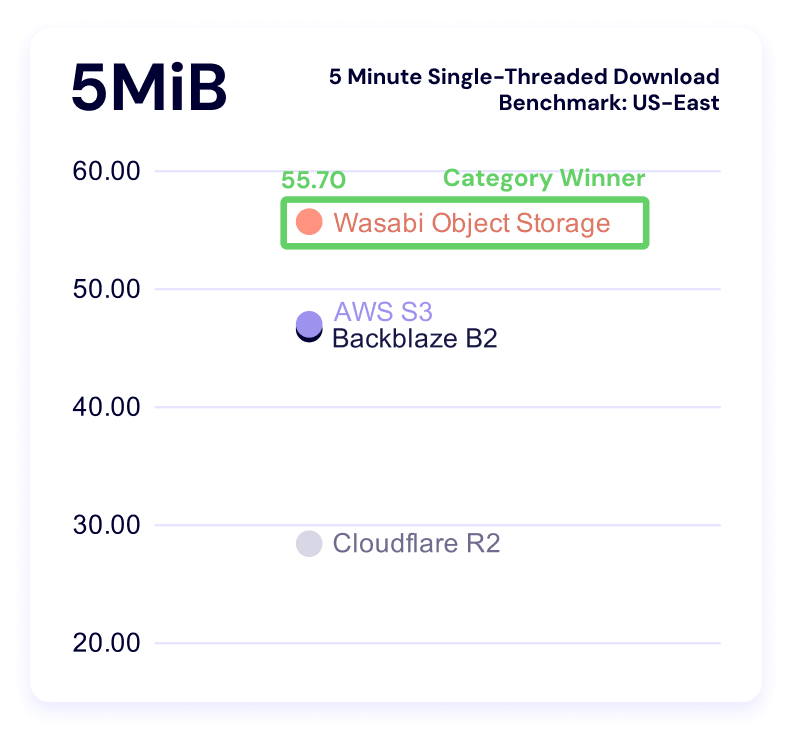
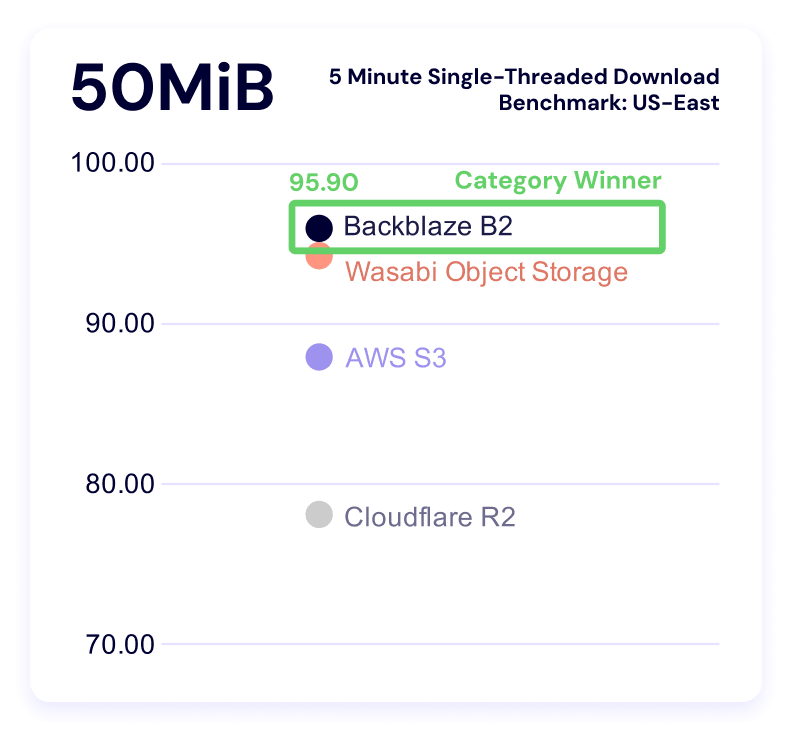
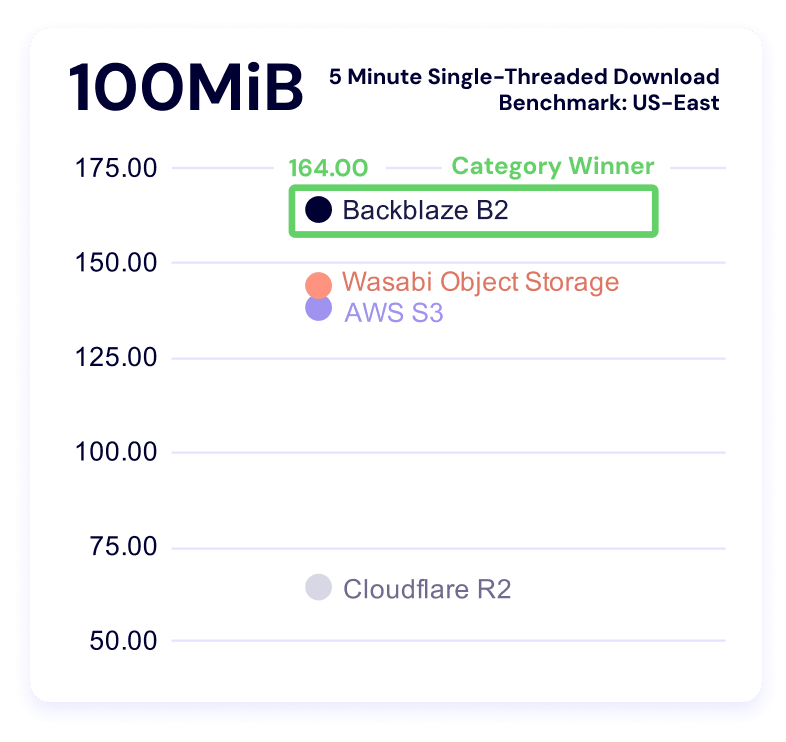
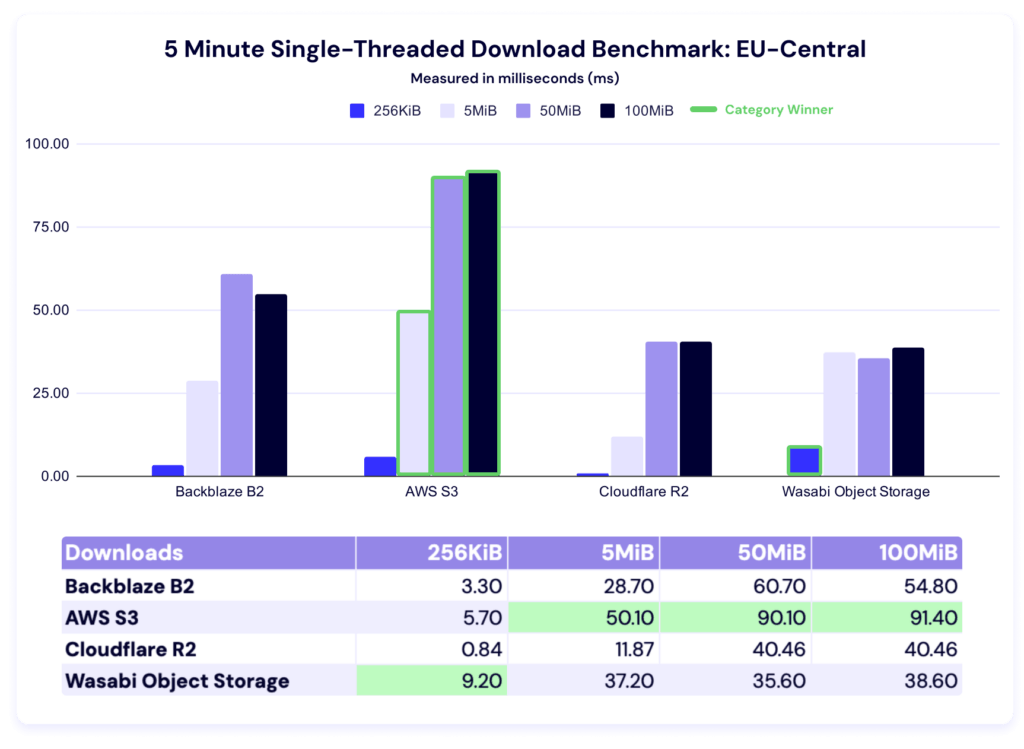
Five minute single-threaded download throughput
Wasabi comes in first for 256KiB and 5MiB files, and Backblaze for 50MiB and 100MiB files.
And here’s our clustering:
EU-Central
Welcome to the new region! We’ll keep editorializing to a minimum—here’s the EU data.
Upload averages
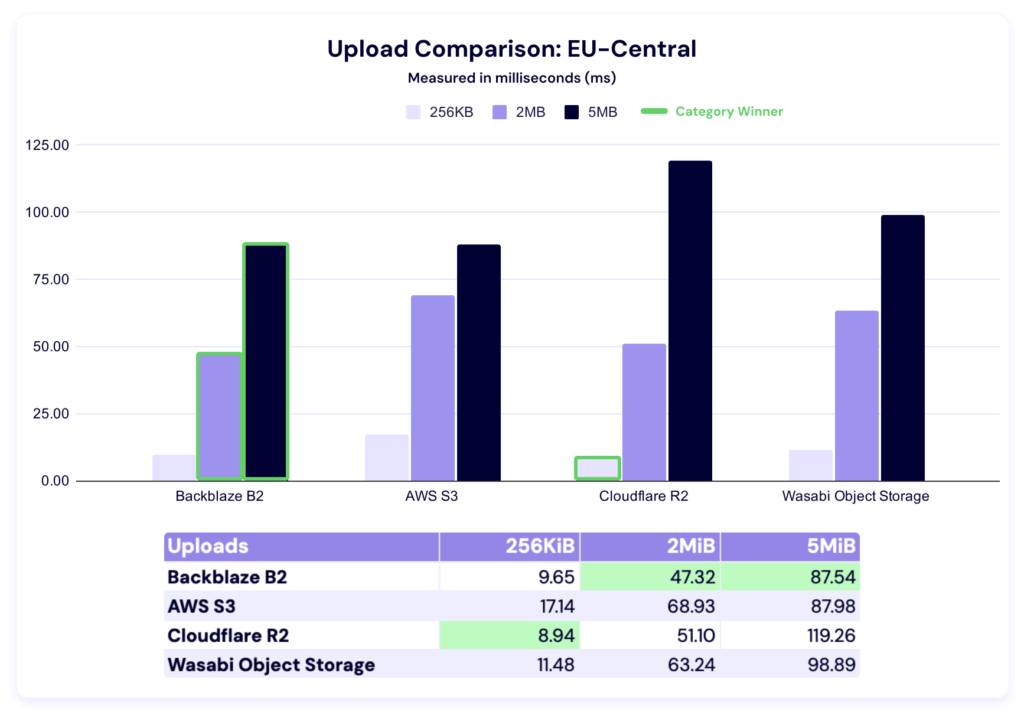
In this test, Cloudflare R2 takes the 256KiB category, while Backblaze is the fastest for both 2MiB and 5MiB file sizes. It’s tempting to compare these numbers to the US-East performance, but certainly premature.
At the very least, it’s a good reminder of the strength of a multi-cloud approach—there’s always a balance between relying on a single provider regardless of their geographic presence or their strength in your particular use case needs. Specialists bring value to the table if and when their addition doesn’t outweigh the operational costs of complexity.
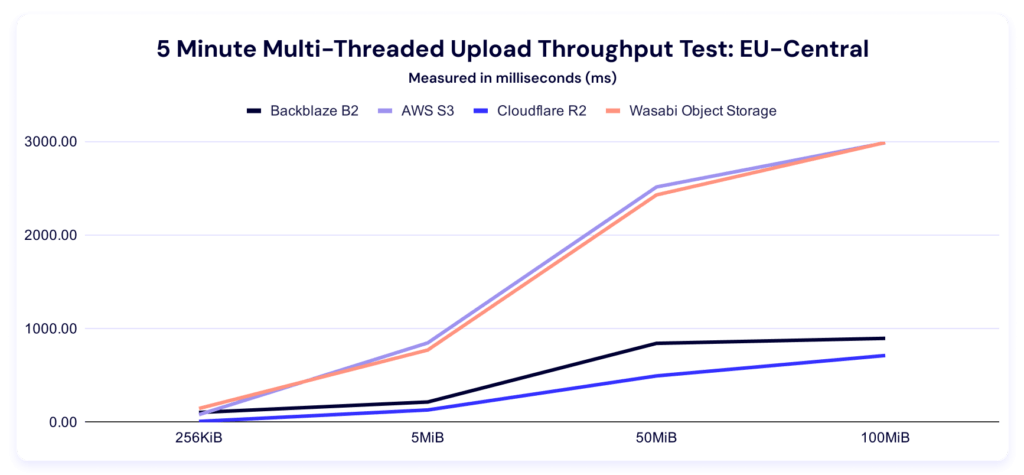
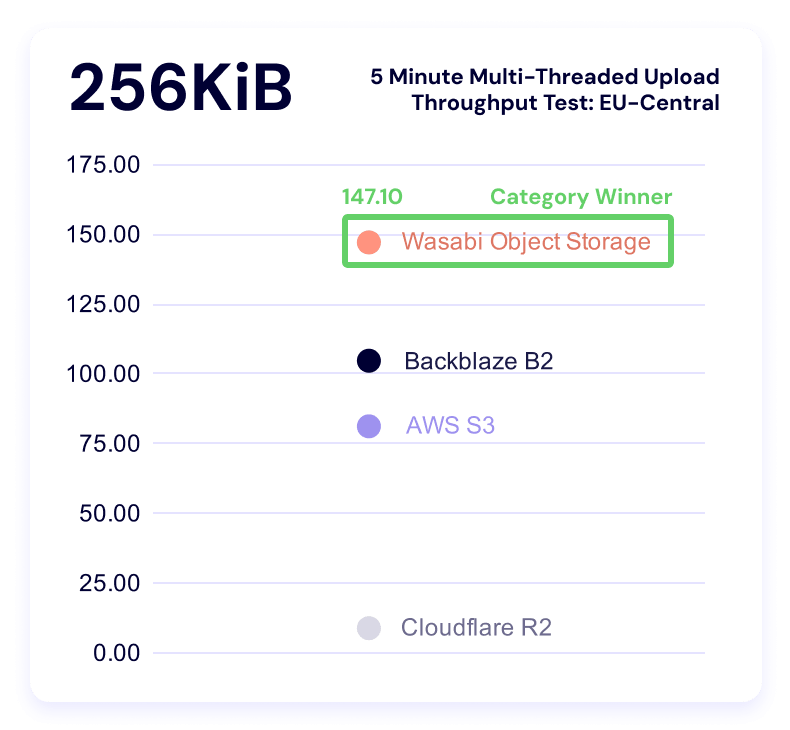
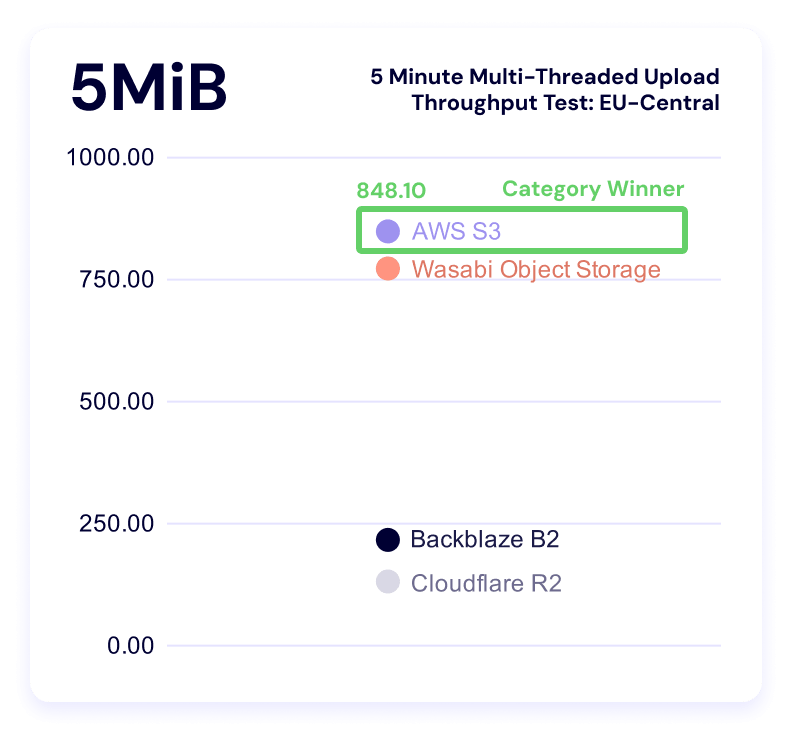
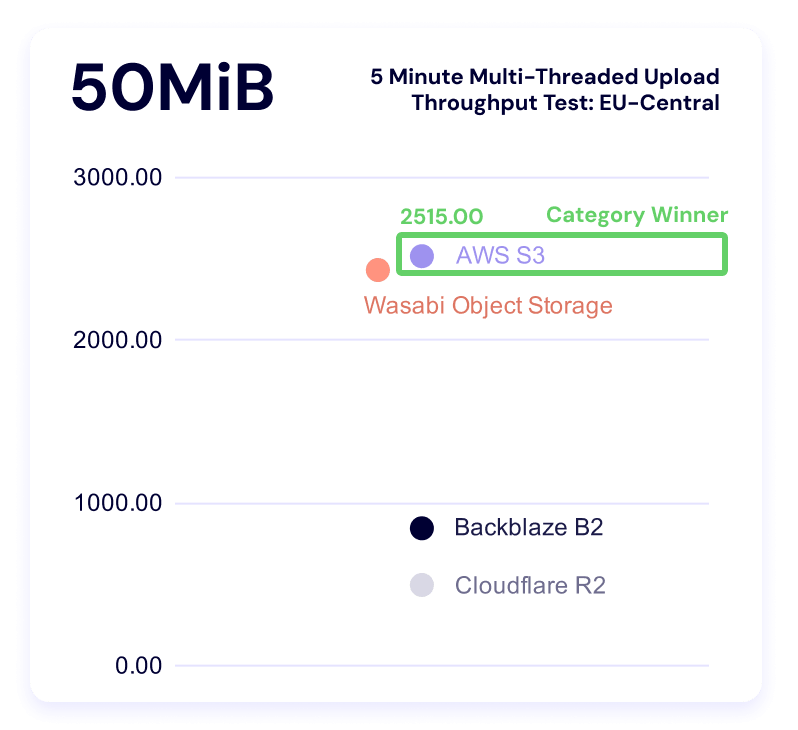
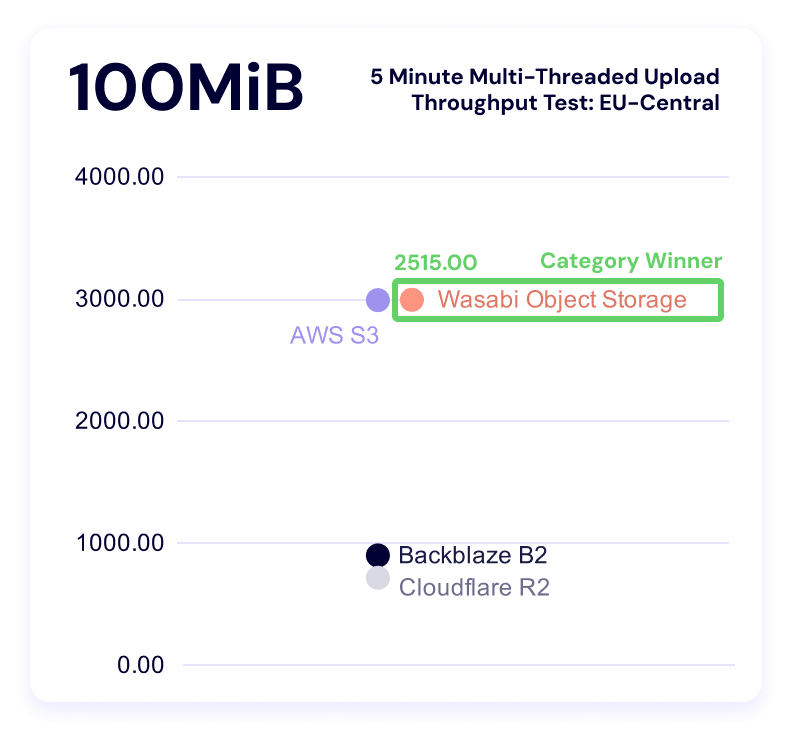
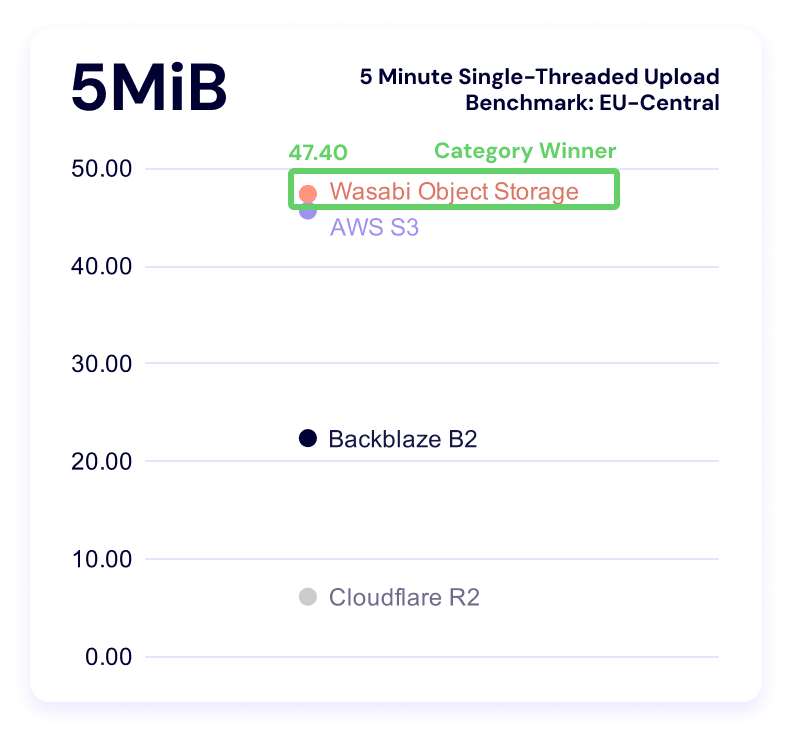
Five minute multi-threaded upload test
Top of section reminder: Higher is better in this test.
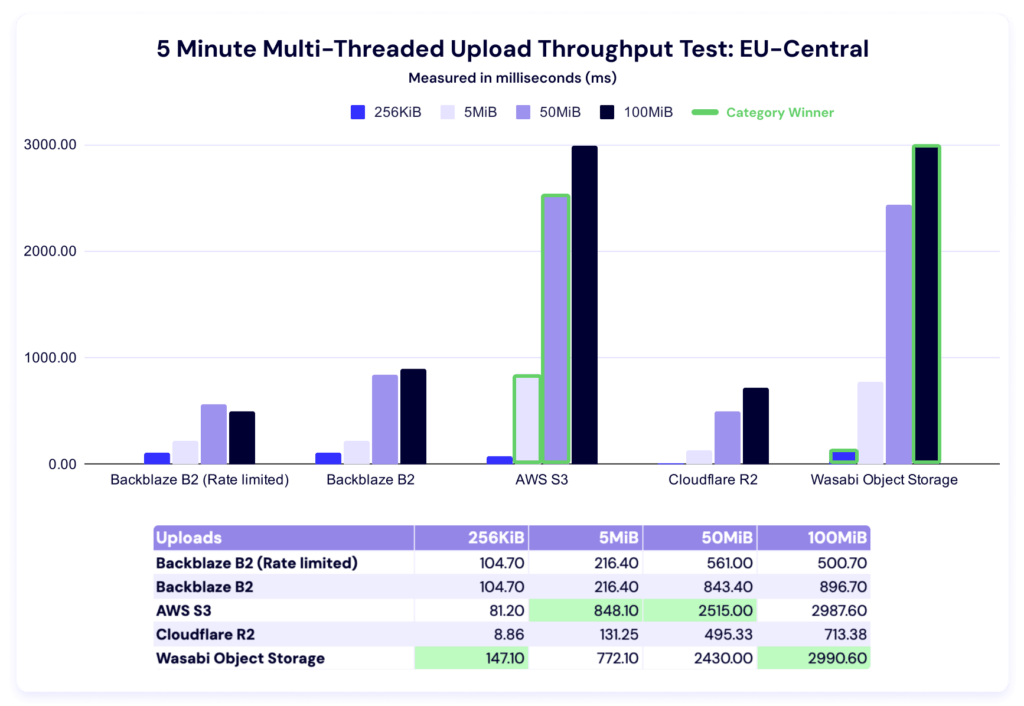
In these results, Wasabi leads in the 256KiB and 100MiB categories, while AWS wins out for the 5MiB and 50MiB file sizes.
Here’s the trendline:
And here’s the by-file-size clustering:
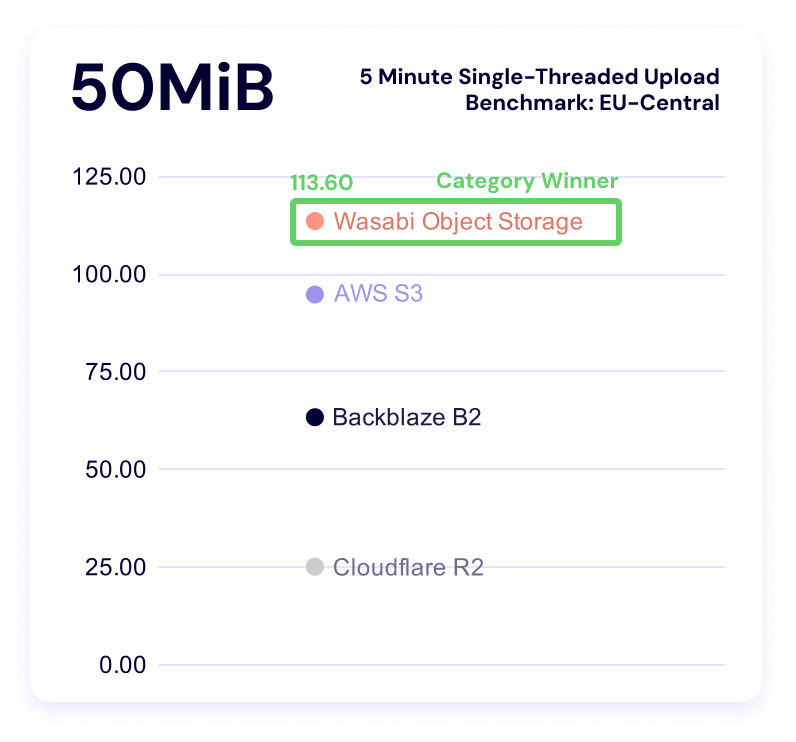
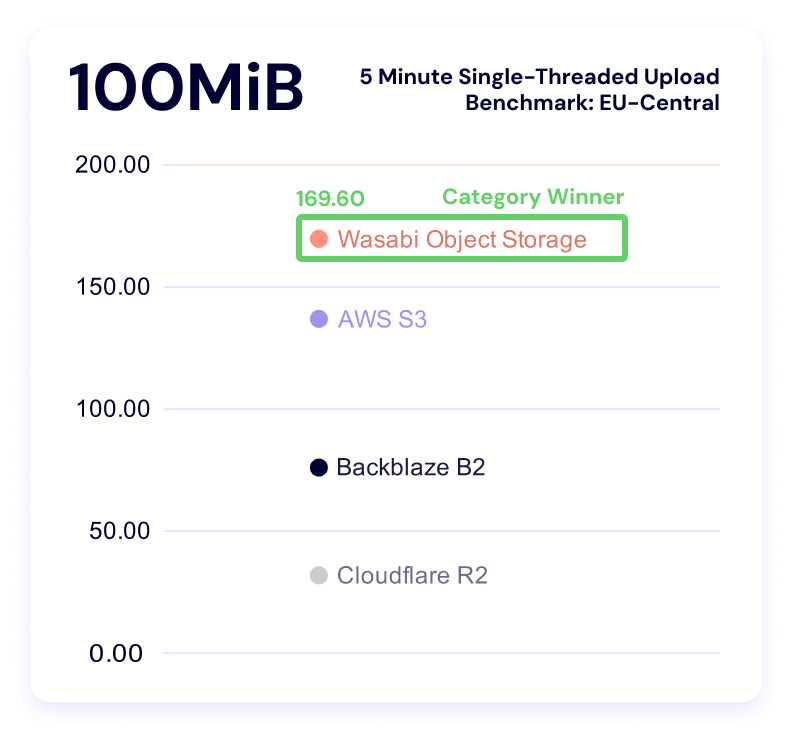
Five minute single-threaded upload test
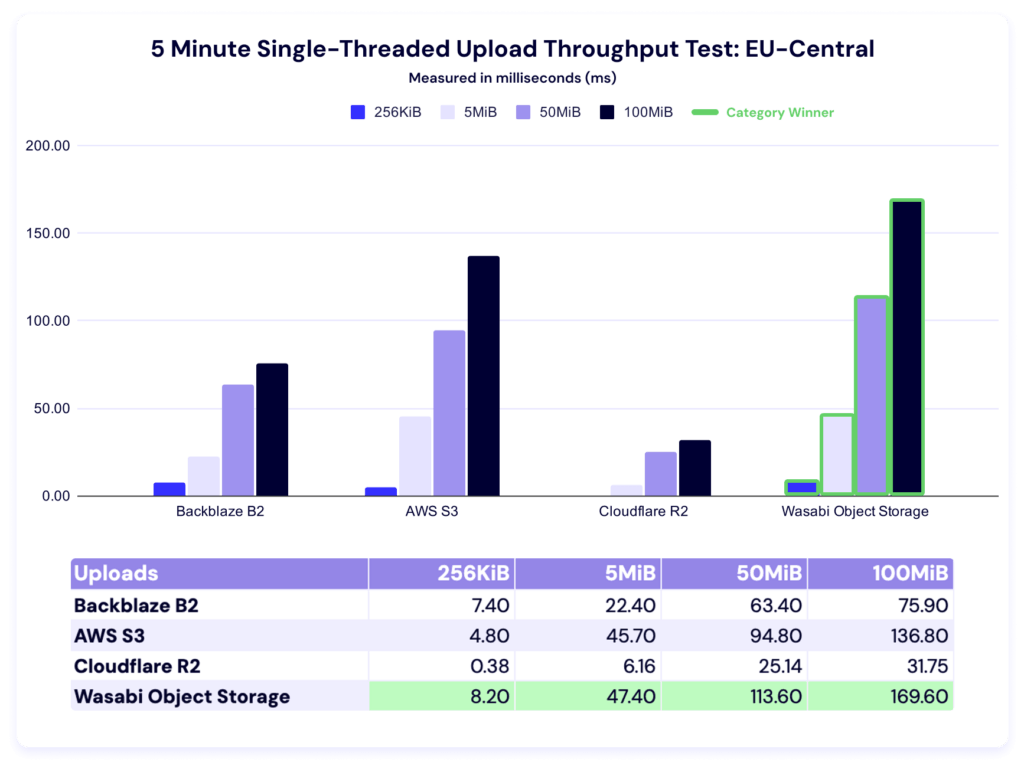
Wasabi dominates this category. Backblaze is a close second for the smallest file size, and S3 takes second for both the 50MiB and 100MiB categories.
Download averages and TTFB
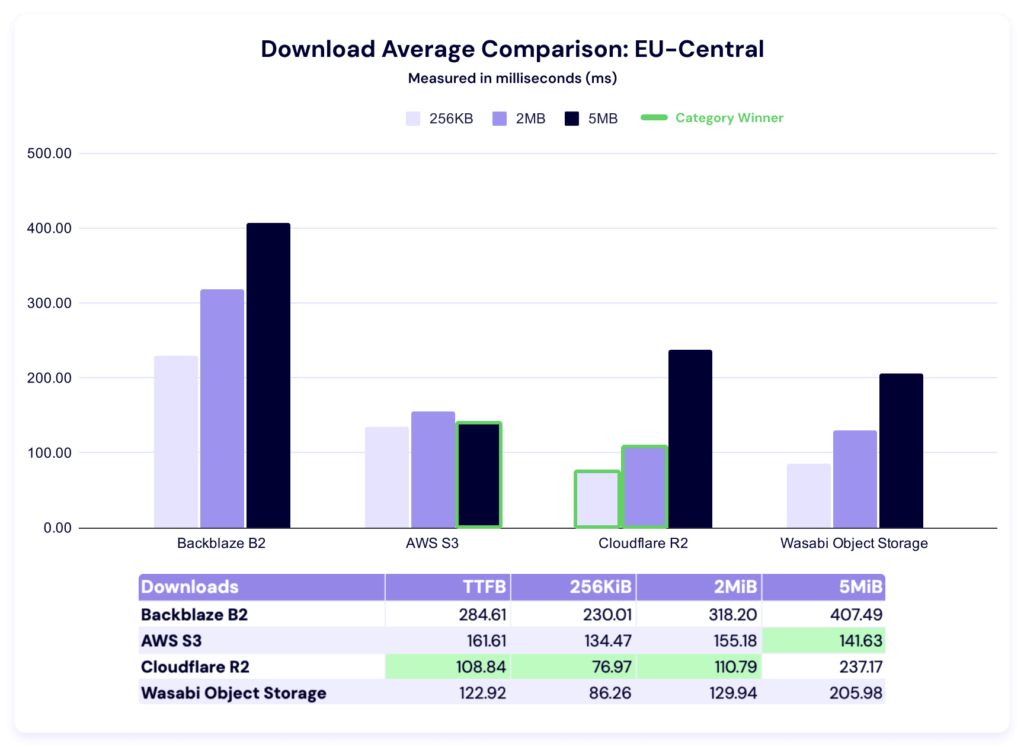
Cloudflare performs well in this region, with the fastest average times in TTFB, 256KiB, and 2MiB categories. AWS wins on the remaining 5MiB file size. Here again we see a huge delta between the highest and lowest average times.
And, here’s our TTFB chart:
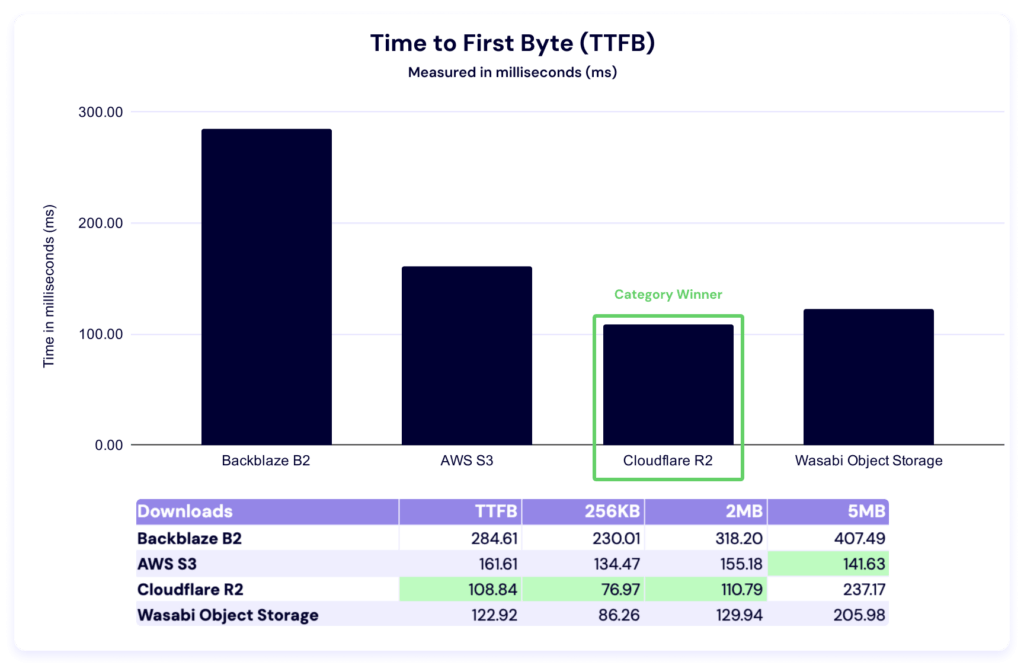
Just like in the Drive Stats series, when we see numbers like this, we do some internal investigation—comparative numbers show us where we can improve, which is why this testing is so critical. We’ve identified an issue we believe was contributing; we’ll report on the impact of our fixes in a future report.
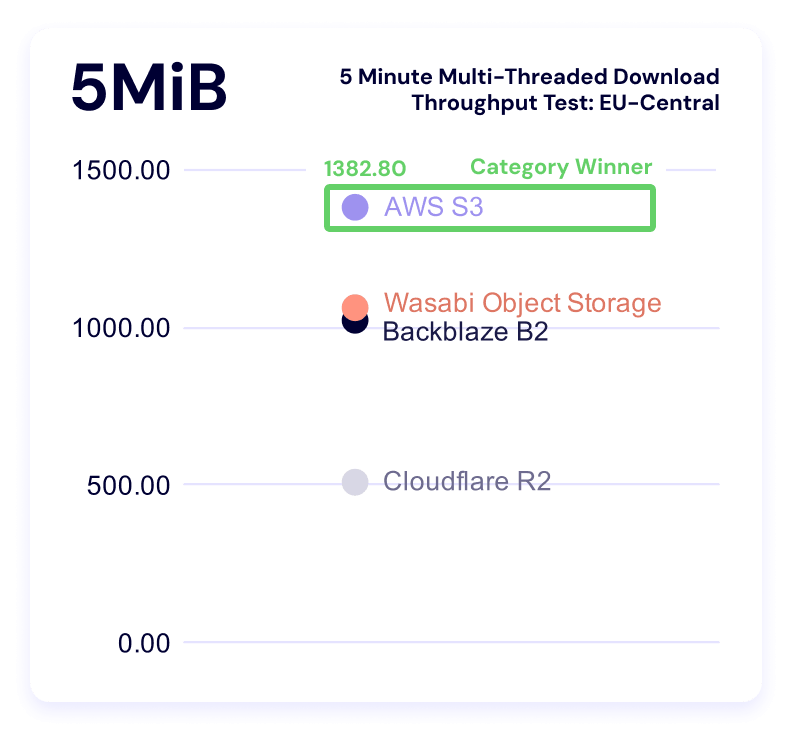
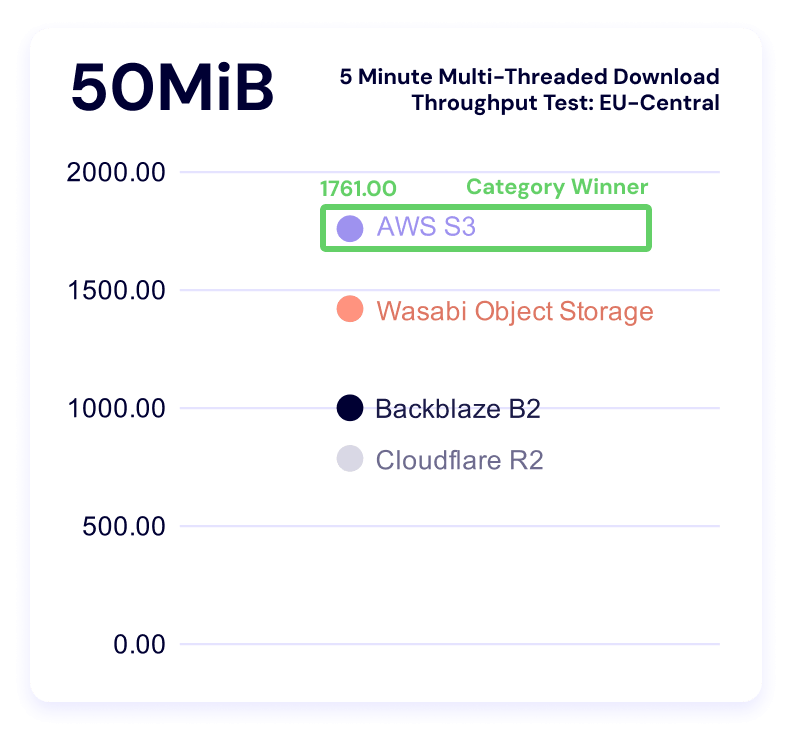
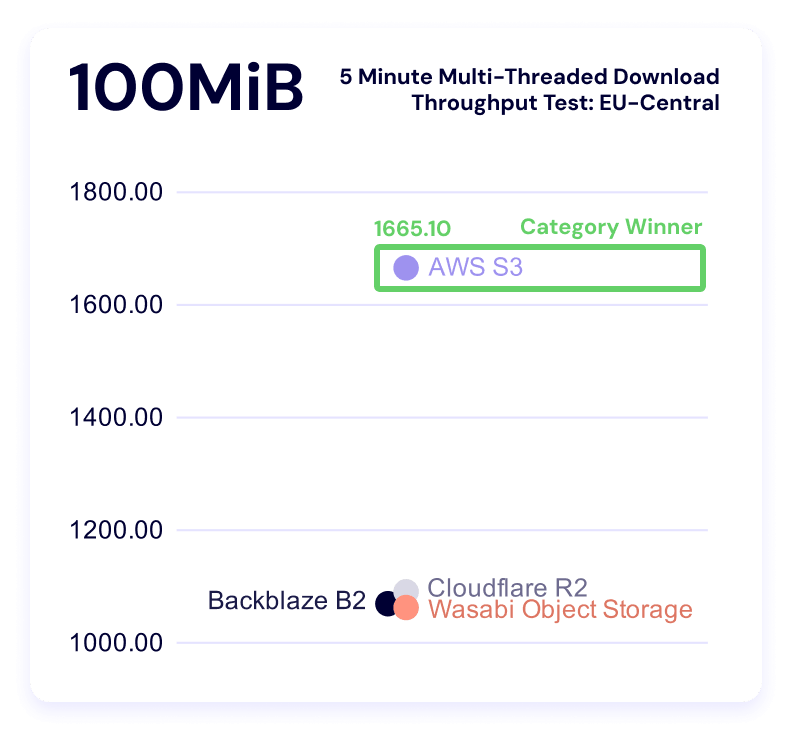
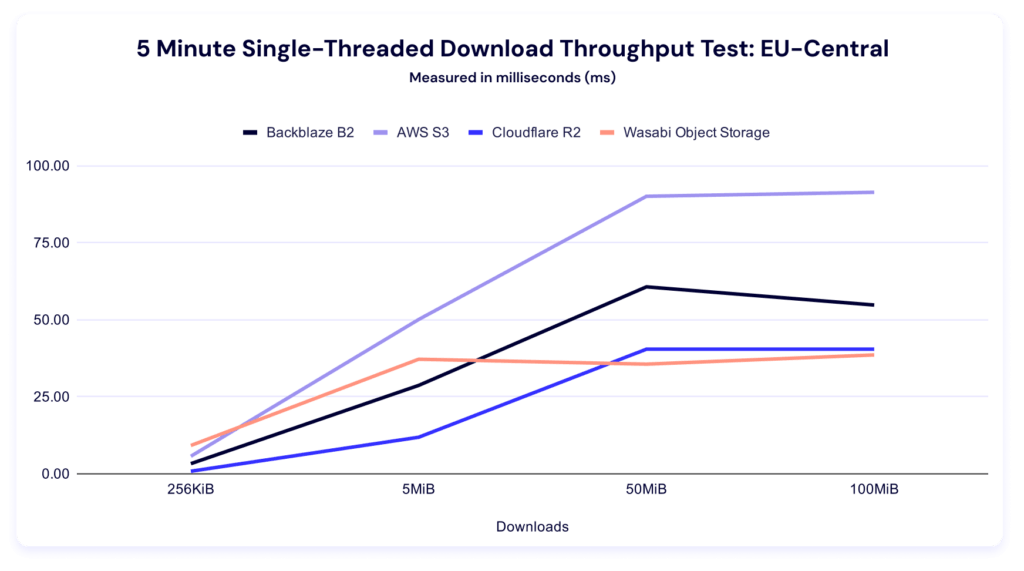
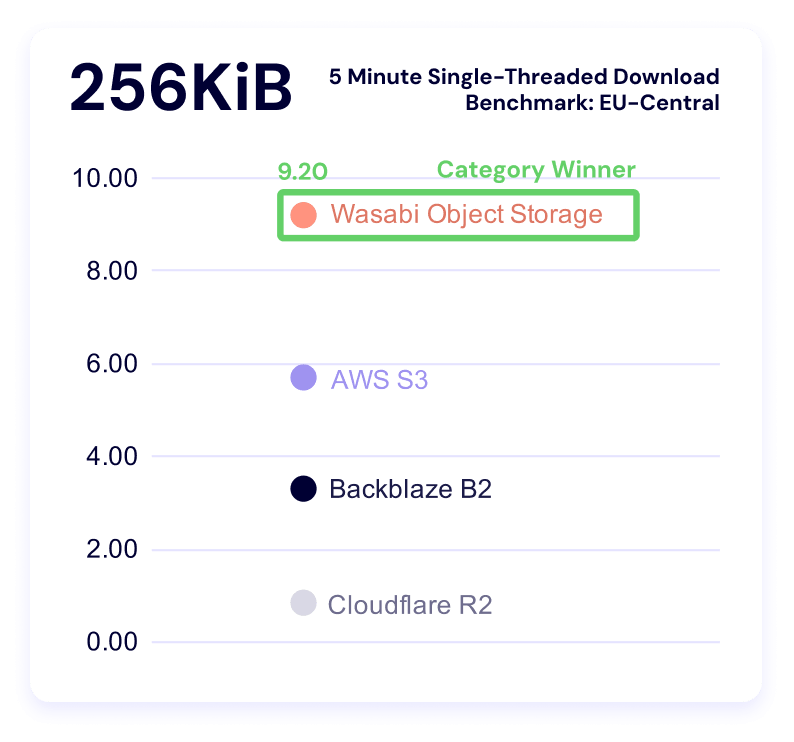
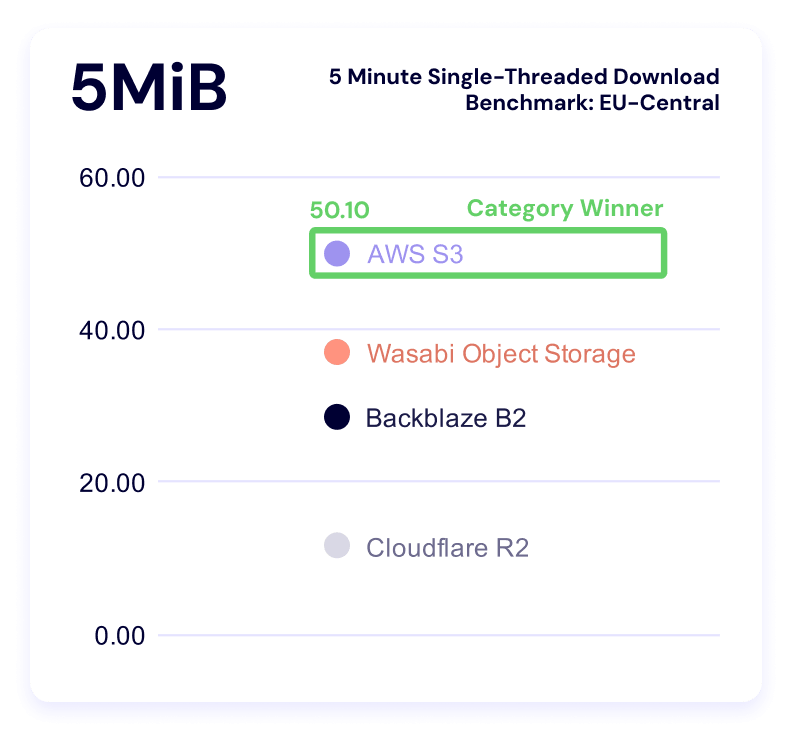
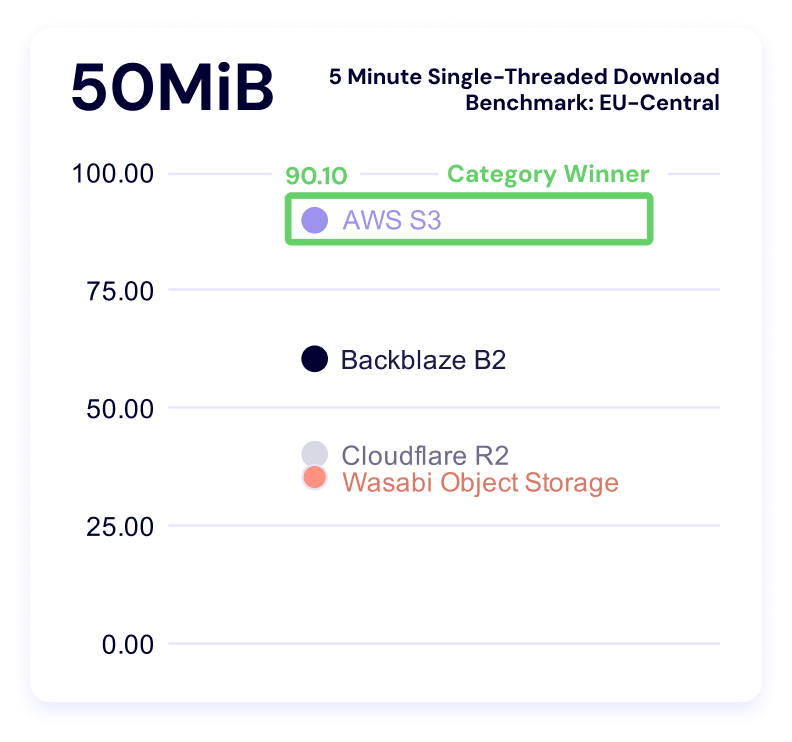
Five minute multi-threaded download test
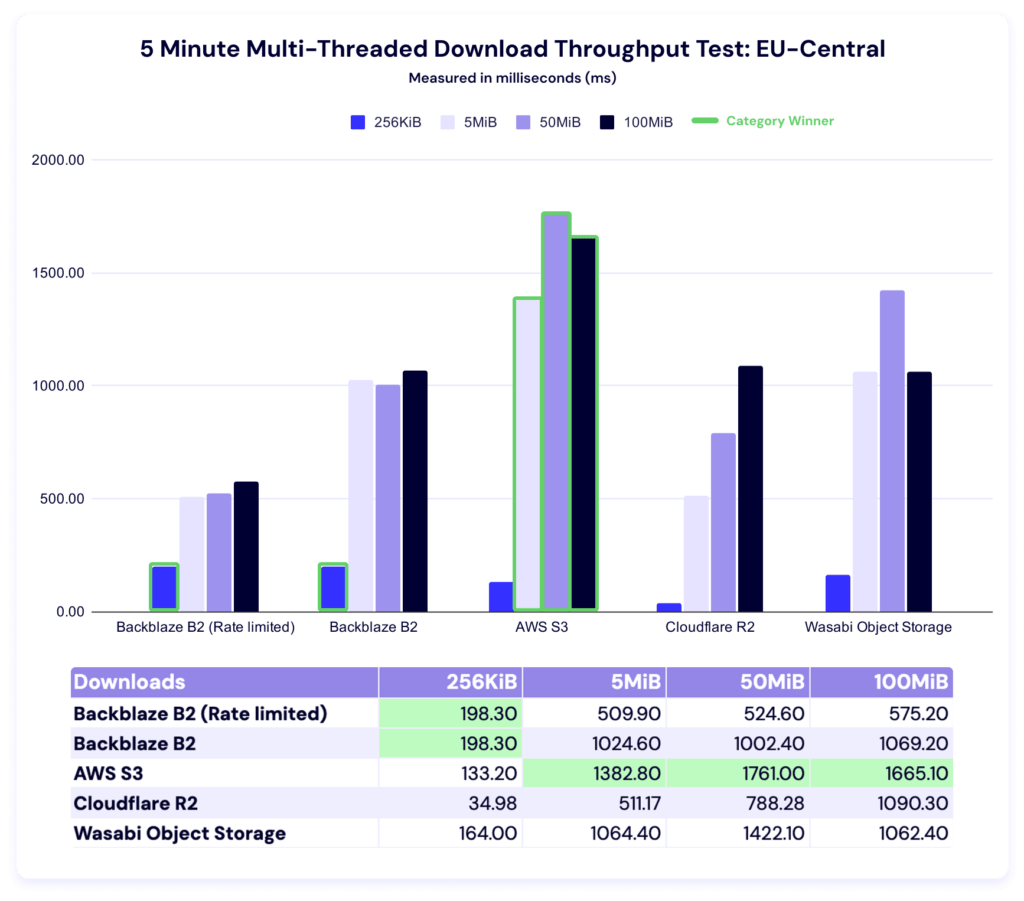
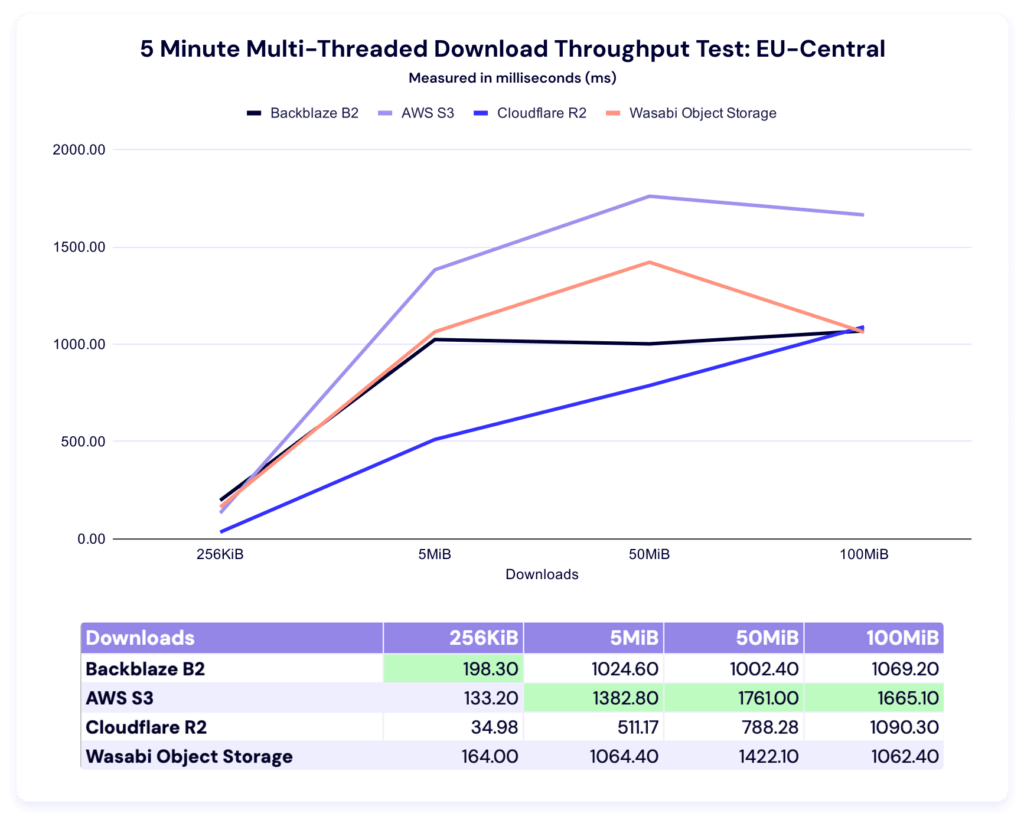
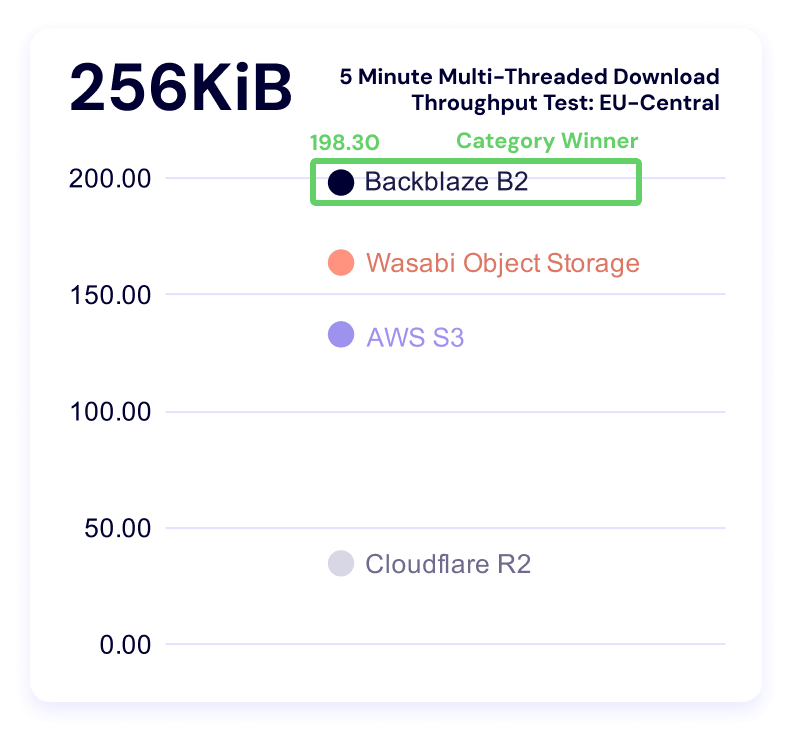
Backblaze leads in the 256KiB file size, while AWS leads in the other three categories. Let’s look at our alternate views.
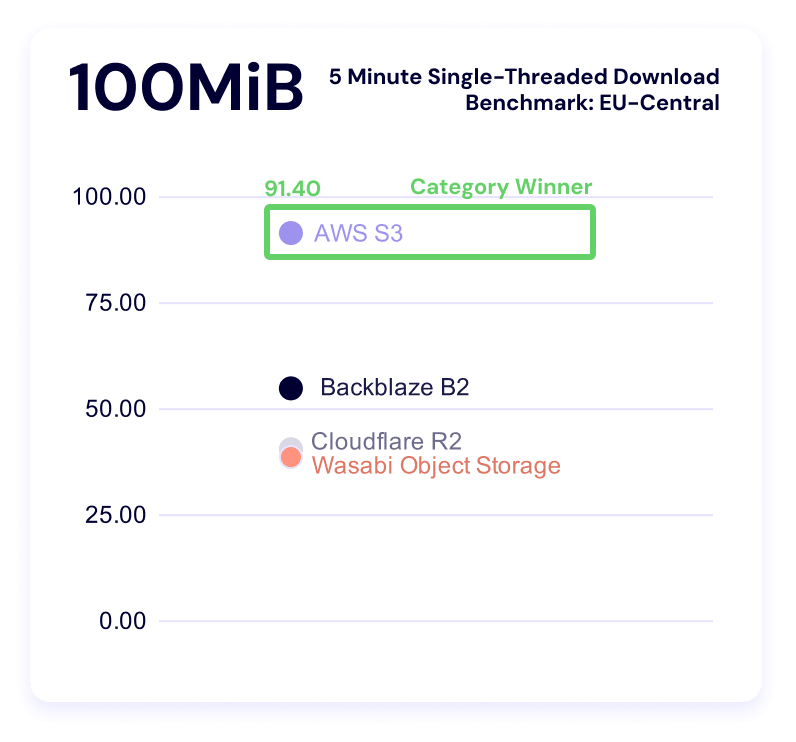
Five minute single-threaded download test
Wasabi comes first in the 256KiB file size, while AWS leads in all other categories. Here’s the trendline:
And our clustering:
Test methodology
Our goal with these benchmarks is simple: to understand how our cloud performs under real-world conditions and to share that information as clearly as possible. To do that, our Cloud Operations team runs repeatable, synthetic tests that measure upload (PUT) and download (GET) performance.
We ran both upload and download tests across all six vendors. Upload tests measured average total time to download a single file of the following file sizes:
- 256KiB
- 2MiB
- 5MiB
Download tests measured:
- Time-to-first-byte (TTFB)
- Average total time to download the following file sizes:
- 256KiB
- 2MiB
- 5MiB
Throughput tests run in five-minute profiles to observe consistency over time, and we ran both single and multi-threaded upload and download tests. From a practical perspective, what’s happening in this test is that we’re pushing repeated requests to a cloud storage provider as many times as we can for five minutes. In multi-threaded tests, we run 20 concurrent threads. Throughput tests use the following file sizes:
- 256KiB
- 5MiB
- 50MiB
- 100MiB
All tests originate from a Vultr-hosted Ubuntu virtual machine (VM) located in the respective test regions (US-East and EU-Central), routing through Catchpoint’s network into the object storage regions. By keeping the source environment stable and the test target consistent, we isolate performance variables within each provider’s infrastructure rather than the test environment itself.
Consistency measures
To ensure each test result represents genuine performance rather than environmental noise, we built repeatability into the process:
- Identical test instances: All runs used the same VM type, operating system (OS) image, and configuration.
- Fixed regions: Tests originated from the same location (NY/NJ) targeting the same US-East or EU-Central region across providers.
- Controlled routing: Network paths were held constant through Catchpoint’s monitoring network to minimize geographic or peering variation.
- Repeated runs: Each test profile (5 min) was executed multiple times, and averages were used to reduce the impact of transient spikes.
- Standardized payloads: All uploads and downloads used identical objects to ensure a consistent file-size baseline.
- Unchanged test intervals: Tests were scheduled at regular intervals over multiple days to capture both typical and outlier performance.
About synthetic testing
Synthetic monitoring provides a controlled, apples-to-apples comparison, but it doesn’t replicate every production workload. These tests are run outside our own infrastructure—from neutral vantage points—to simulate a customer’s experience at the “last mile.” This distinguishes our approach from competitors who benchmark internally under optimized conditions.
It’s important to note that synthetic results won’t mirror every customer’s experience. Different architectures, connection paths, and file patterns will produce different performance profiles. Our intent is to offer transparency into the methodology and relative behaviors, not to suggest that all workloads will perform identically.
Limitations and future work
Every benchmark is an approximation. These results provide a controlled look at how cloud storage performs under repeatable conditions, but they don’t capture every variable in production environments. Below, we outline what our current tests don’t measure and where we’re headed next to deepen the picture.
- Synthetic, not real-world workloads: These benchmarks simulate real activity but don’t reproduce the full variability of customer workloads, concurrency levels, or data locality patterns. They are best understood as directional insights rather than absolute truths.
- The internet is the internet: Once traffic leaves the test node, we can’t control the routing, peering, or transient network conditions between endpoints. Each provider’s own network policies and routing optimizations—for example, Wasabi’s inbound connection rules—can influence the results.
- File size constraints: Our testing environment currently limits file sizes to 10MiB or smaller due to timeout thresholds. That means we can’t yet model the large-object transfers typical of certain workloads.
- Static test conditions: All tests were conducted from a single region (NY/NJ to US-East cloud providers). Real-world customers operate globally, where peering arrangements, congestion, and latency differ widely.
- Potential caching effects: Although we designed the tests to avoid cached reads, Catchpoint does not allow full data randomization. It’s possible some repeated reads benefited from intermediate caching at any network layer.
- Traffic shaping and rate limiting: Providers may apply rate limits or throttling when detecting high-frequency test traffic. For example, Wasabi temporarily blacklisted our IPs due to testing volume—a reminder that these results represent observed behavior, not formal service guarantees.
Your mileage may vary, or what this means in the real world
One of the reasons it’s so hard to get directly comparable performance benchmarks is because there are so many configurable elements on the user’s side that can affect the results. For example, if you know that your provider is faster on smaller files, you might choose to store your unstructured data in smaller parts so that you achieve faster performance.
We did some comparison between existing use cases that Backblaze succeeds based on the data above including AI/ML inference, feature stores and embedding lookups, LLM-based RAG systems, log and event analytics, interactive data lake querying, and CDN origin. The biggest takeaway is something that we noted when talking about the EU metrics—specialists bring flexibility to the table, which is where you truly start to unlock value.
For a cloud storage provider, tracking these metrics over time and comparing to other aspects of our internal architecture enables us to support ongoing and continual performance improvement, and to understand how much of an impact single changes might make. This means that what seems like a simple project to change the way we read header requests can produce asymmetrically favorable results.
What’s next?
Performance is an evolving target, and this dataset is still early. What we can say today is directional: different providers behave differently under different conditions, and those differences become more pronounced as workloads scale.
We’ll keep expanding this work in future reports—across regions, workloads, and test conditions—with the expectation that clearer patterns will emerge. In the meantime, the most valuable use of this data is to map it against your own systems, your own constraints, and your own definition of performance.
If you’re doing that, we’d like to hear what you’re seeing. Sound off in the comments below, on socials, drop us a line by email, or send us some questions you want answered in the upcoming webinar.