With hundreds of thousands of hard drives spinning 24/7, our data centers are less like peaceful white-noise oases and more like a a series of obstacle courses—if said obstacle courses were about managing over four exabytes of storage from archival backups to streaming media to AI training datasets. Sure, they’re obstacle courses we all (and I’m including you, users of the internet) collectively create, but it’s no less of a balancing act to find the contestants (erm, hard drives) that can go the distance.
And we, dear readers, get to watch it all. Welcome to Drive Stats: where failure is inevitable, survival is fascinating, and every quarter brings a new leaderboard.
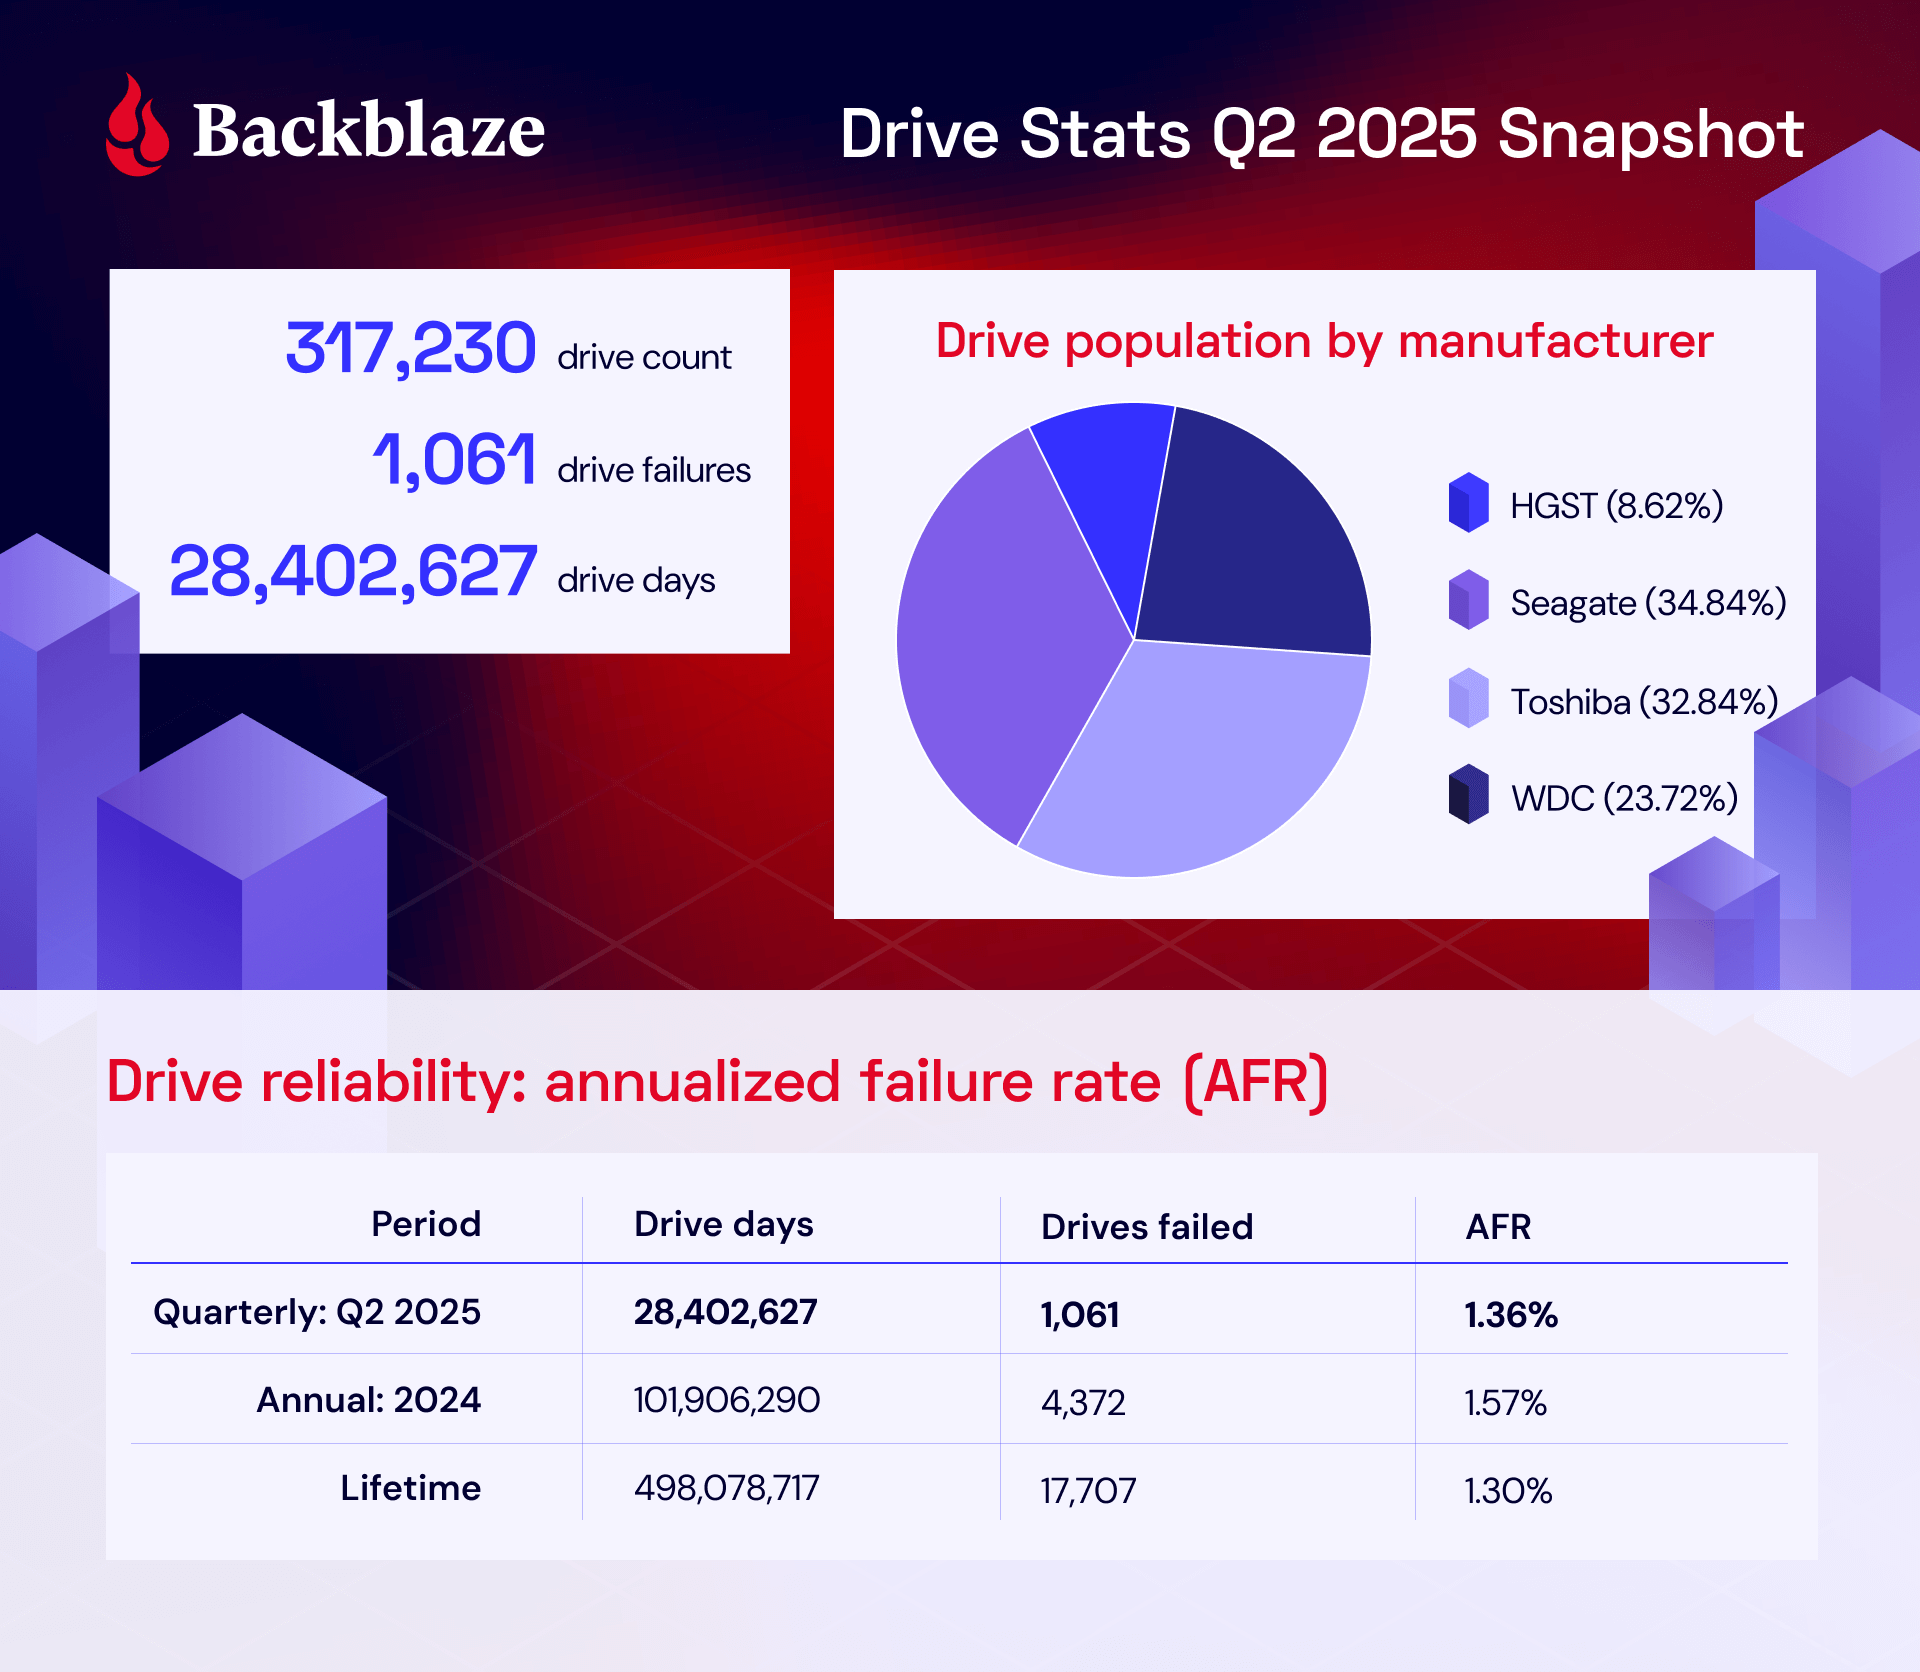
As of June 30, 2025, we had 321,201 drives under management. Of that total, there were 3,971 boot drives and 317,230 data drives. Stay tuned as we take our standard peek into quarterly and lifetime failure rates, and do a deep dive into the 20TB+ club.
As always, we’ll see you in the comments section. This month, you’ll also get three (count ‘em, three!) opportunities to talk to us in person as well—virtually at our Drive Stats LinkedIn Live on August 5 (today), or twice in Las Vegas at DefCon on August 7 and 8.
And, after DefCon, we’ll be sticking around in Vegas to attend Ai4 August 11–13—stop by booth 226 if you’ll be in the neighborhood, and check out our colleague Jeronimo De Leon’s talk on storage and AI if you’re free.
Sign up for the Drive Stats LinkedIn Live
Ready to dive deeper into the data? Tune in today at 10:00 a.m. PT, to query the Drive Stats team, Stephanie Doyle and Pat Patterson. We’ll see you there!
Drive Stats by the numbers: The digest version
Q2 2025 hard drive failure rates
For those that are new to the Drive Stats report, it’s worth mentioning that we have certain criteria that we use to select drives for consideration each quarter. We’ll discuss those in the next section, but for now, let’s talk about the data. The table below shows the failure rates for Q2 2025.
Backblaze Hard Drive Failure Rates for Q2 2025
Reporting period April 1, 2025–June 30, 2025 inclusive
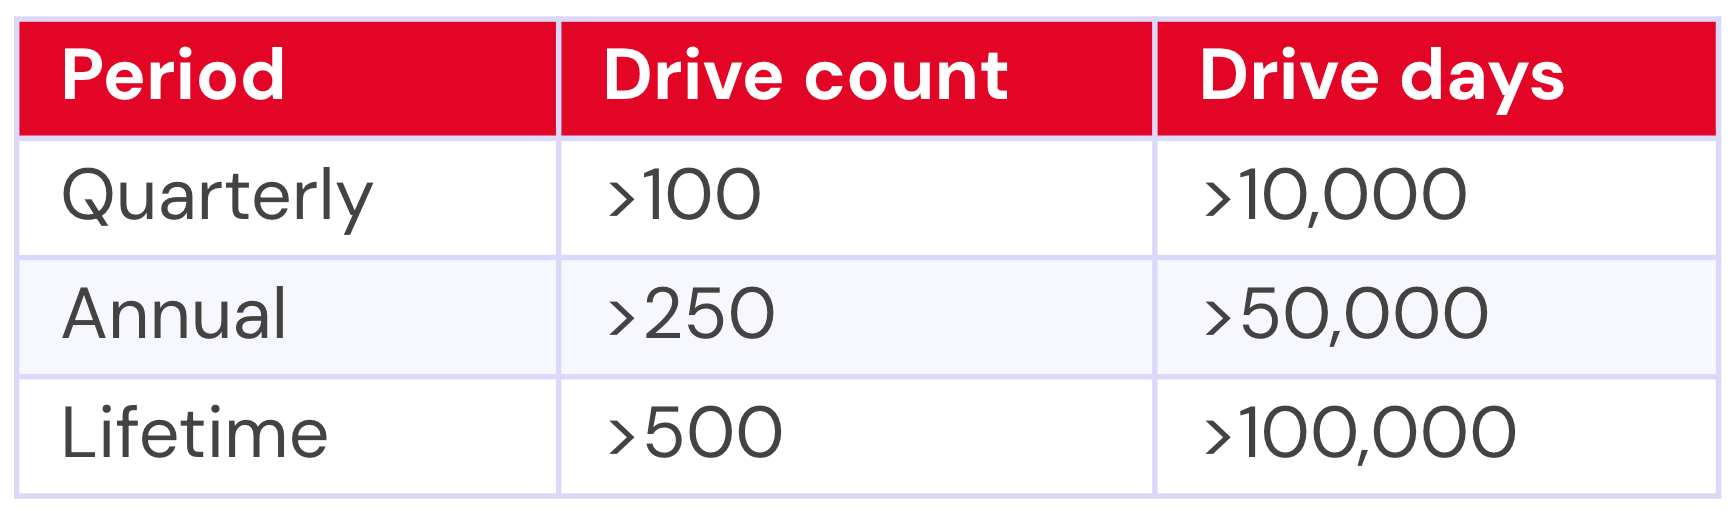
Drive models with drive count > 100 as of June 30, 2025 and drive days > 10,000 in Q2 2025
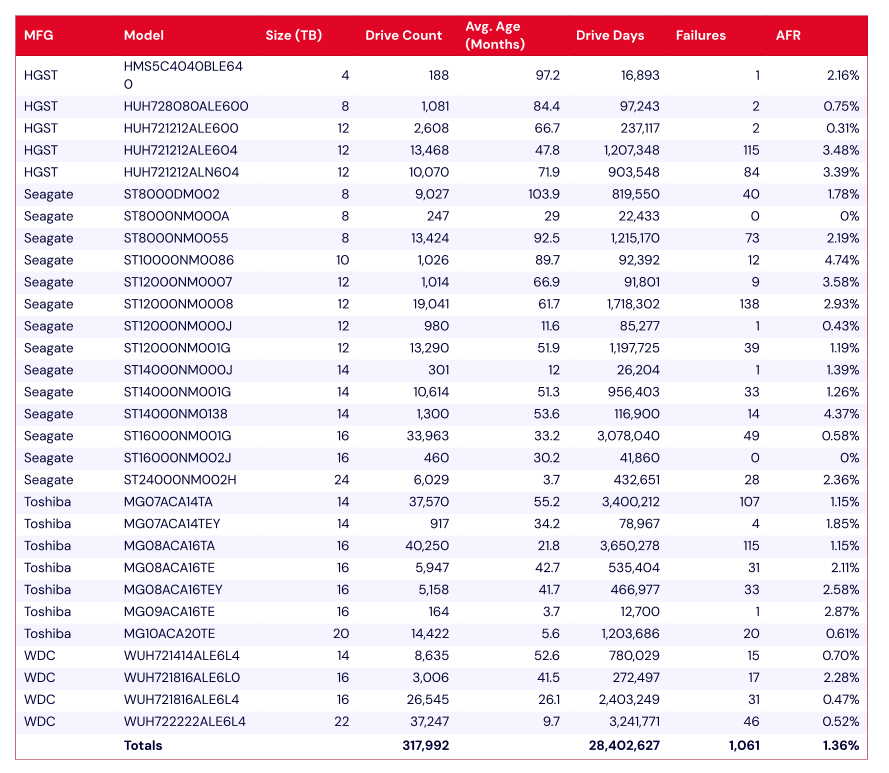
Notes and observations
- The annual failure rate is lower this quarter. We had some major fluctuations last quarter. Quoting ourselves from May 2025:
The quarterly failure rate is slightly higher. The quarterly failure rate went up from 1.35% to 1.42%. As with the zero-failure club, our higher-end outlier AFRs show some of the usual suspects:
We’re now back down to 1.36%. What’s changed?
- Big swings in our higher-end failure rates: Well, some of the drives with higher failure rates have come down quite a bit. Notably, that includes the 12TB Seagate model ST12000NM0007, which was at a whopping 9.47% failure rate last quarter—down this quarter to only 3.58%. With its drive count holding more or less steady (1,038 in Q1 and 1,014 in Q2), that means a real change in failure rates. Note that this drive was at 8.72% in Q4 2024, so it’s worth keeping an eye on whether this is a fluke or a new pattern. Other significant drops include the 12TB HGST model HUH721212ALN604 (Q1: 4.97%; Q2: 3.39%) and the 14TB Seagate model ST14000NM0138 (Q1: 6.82%, Q2: 4.37%).
- One new drive model on the way in: Welcome to the party, Toshiba MG09ACA16TE (16TB).
- Zero failures for the quarter: Rising to the top, we’ve got only two this time around:
- Seagate ST8000NM000A (8TB)
- Seagate ST16000NM002J (16TB)
That 8TB Seagate is really shining, given this is its third quarter running with zero failures.
- Bonus: One failure drives: Since we only have two 0 failures (and that just seems a little lackluster, doesn’t it?), it’s also worth mentioning the drives with only one failure this quarter:
- HGST HMS5C4040BLE640 (4TB)
- Seagate ST12000NM000J (12TB)
- Seagate ST14000NM000J (14TB)
- Toshiba MG09ACA16TE (16TB)
Drive model criteria
We noted earlier we removed 495 drives from consideration when we produced the table above covering Q2 2025. There are two primary reasons we did not consider these drive models.
- Testing. These are drives of a given model that we monitor and collect Drive Stats data on, but are not considered production drives at this time. For example, drives undergoing certification testing to determine if they are performant enough for our environment are not included in our Drive Stats calculations.
- Insufficient data points. When we calculate the annualized failure rate for a drive model for a given period of time (quarterly, annual, or lifetime), we want to ensure we have enough data to reliably do so. Therefore we have defined criteria for a drive model to be included in the tables and charts for the specified period of time. Models that do not meet these criteria are not included in the tables and charts for the period in question.
Regardless of whether or not a given drive model is included in the charts and tables, all of the data for all of the drives we use is included in our Drive Stats dataset which you can download by visiting our Drive Stats page.
As with the Q2 quarterly results, we will apply these criteria to the lifetime charts that follow in this report.
Lifetime hard drive failure rates
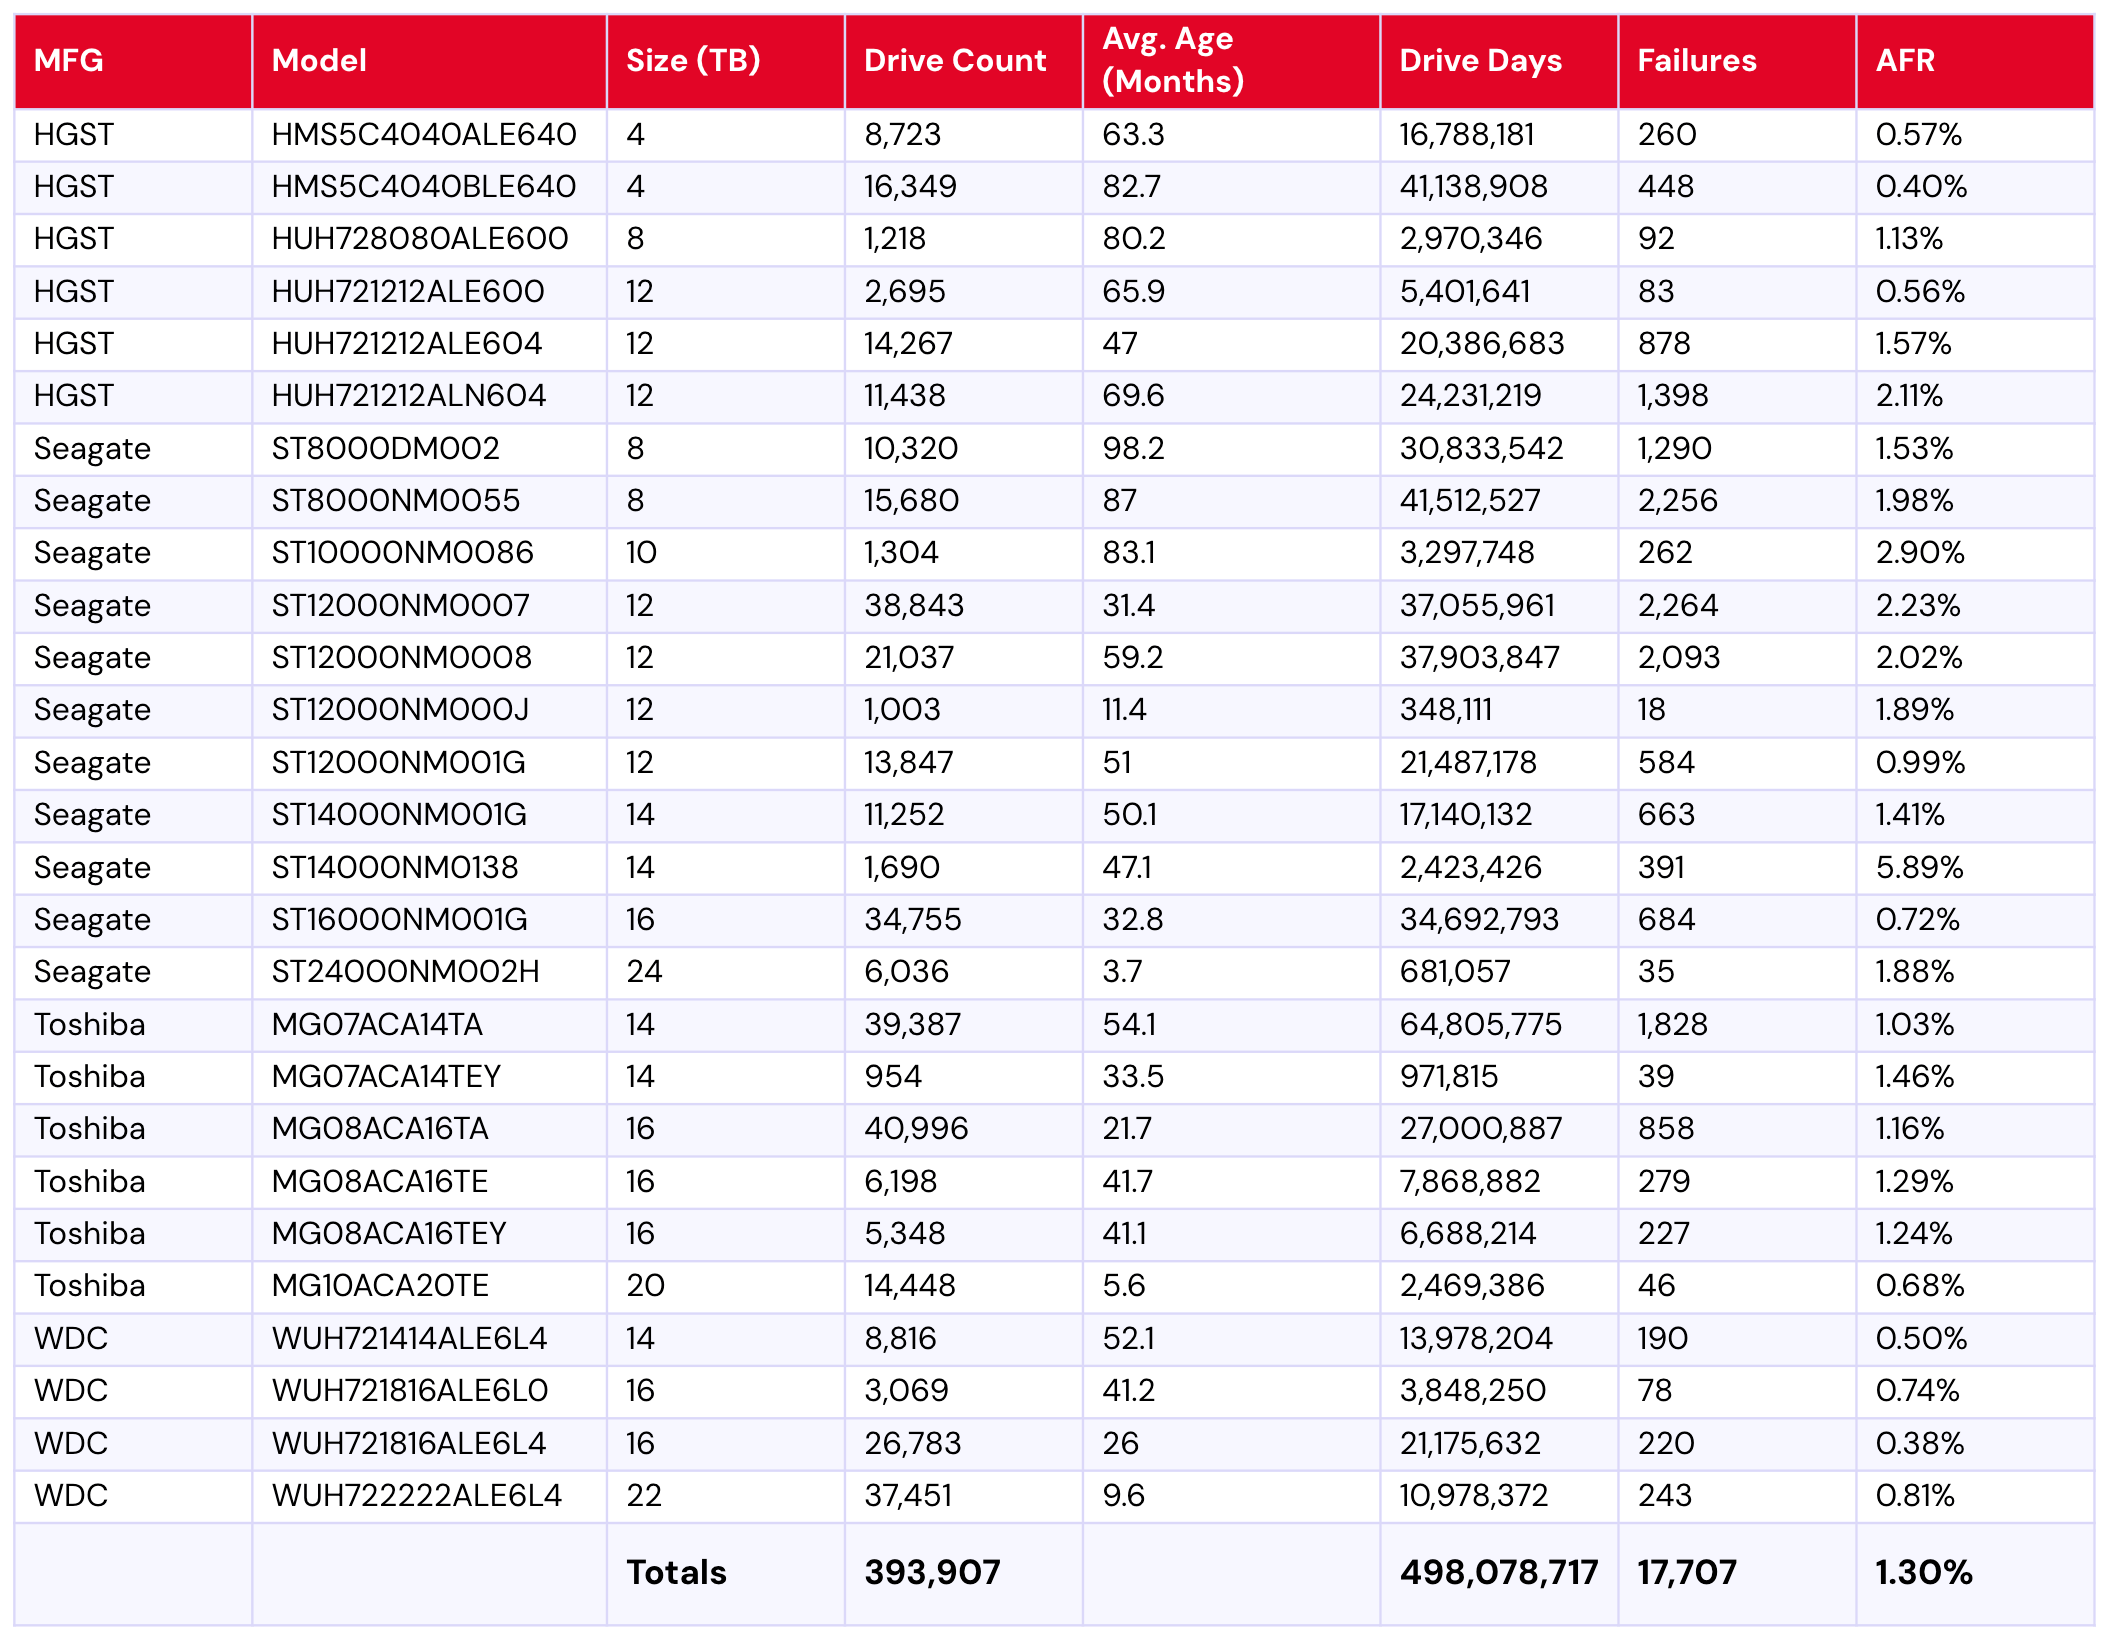
To be considered for the lifetime review, a drive model was required to have 500 or more drives as of the end of Q2 2025 and have over 100,000 accumulated drive days during their lifetime. When we removed those drive models which did not meet the lifetime criteria, we had 393,907 drives grouped into 27 models remaining for analysis as shown in the table below.
Backblaze Hard Drive Failure Rates for Q2 2025
Reporting period ending June 30, 2025
Drive models > 500 drives and > 100,000 lifetime drive days
Notes and observations
Again, the lifetime AFR holds steady, dropping from Q1 2025’s 1.31% to 1.30%.
- Now you see me: This quarter’s table also gives us an interesting snapshot that has to do with our drive exclusions as the 4TB HGST model HMS5C4040ALE640 is on the way out. It meets our lifetime drive criteria, so it is included in this second table, but it didn’t make the cut for the quarterly table because it had too few drives running by the end of the quarter. Usually you see the opposite, where drive models show up in the quarterly requirements but not the lifetime. This quarter, four models meet that standard (Seagate model numbers ST8000NM000A, ST14000NM000J, ST16000NM002J, and Toshiba MG09ACA16TE).
- Smaller drives getting older: Perhaps an unsurprising trend—Backblaze’s smaller capacity drives are getting older. We have a total of 13 drive models with 12TB or less, with a collective 1.54% failure rate. See the table below:
Backblaze drives with ≤12TB capacity
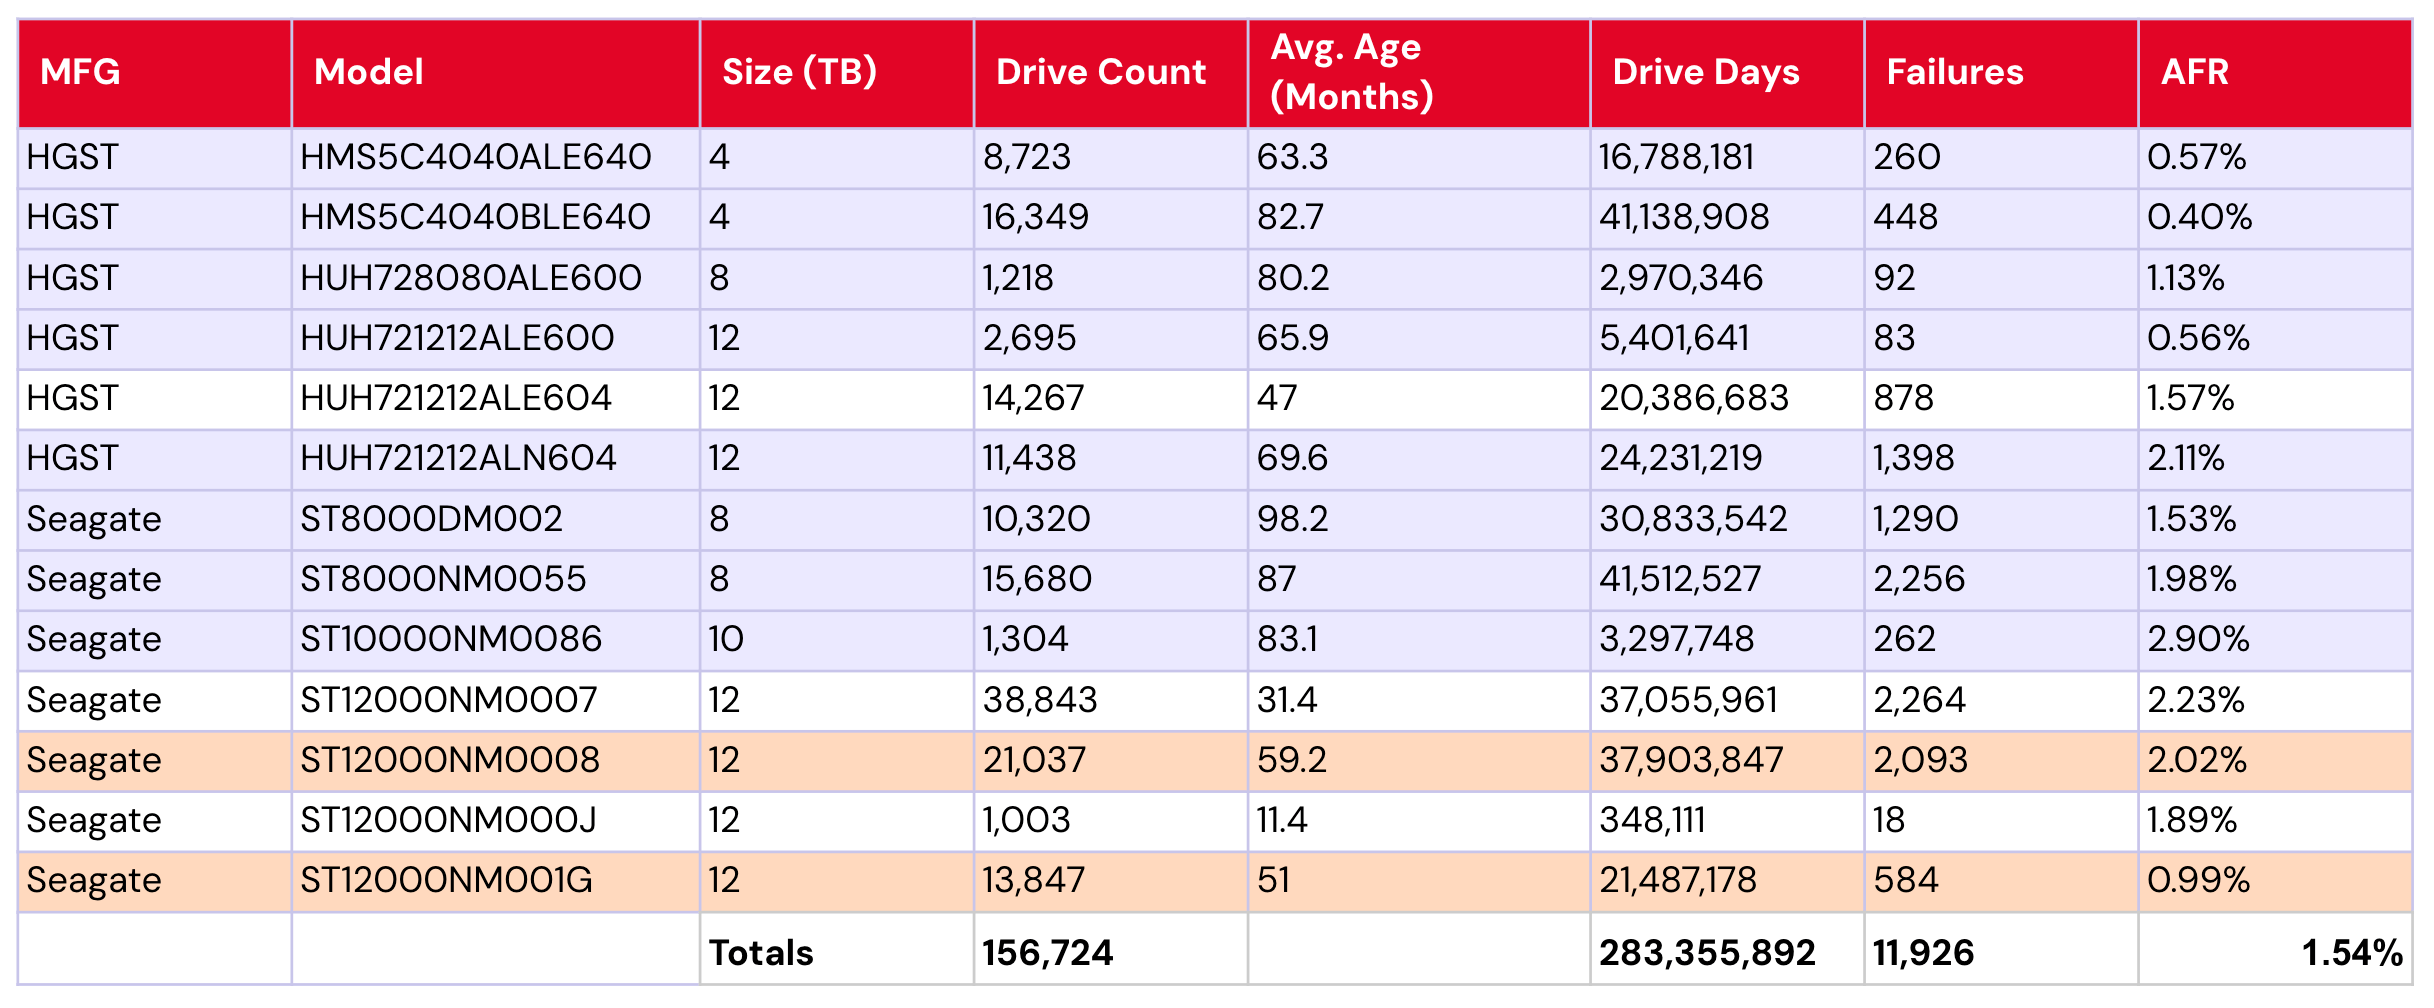
Of those models, eight are five years old or older (shown in purple). An additional two models are four years or older (that’s your orange). Taking just these 10 models—drives reaching their supposed golden years—we have a collective AFR of 1.42%.
Notably, that AFR is due to some well-performing low-failure outliers, including both of the 4TB HGST models (0.57% and 0.40%), the 12TB HGST model HUH721212ALE600 (0.56%), and the 12TB Seagate model ST12000NM001G (0.99%).
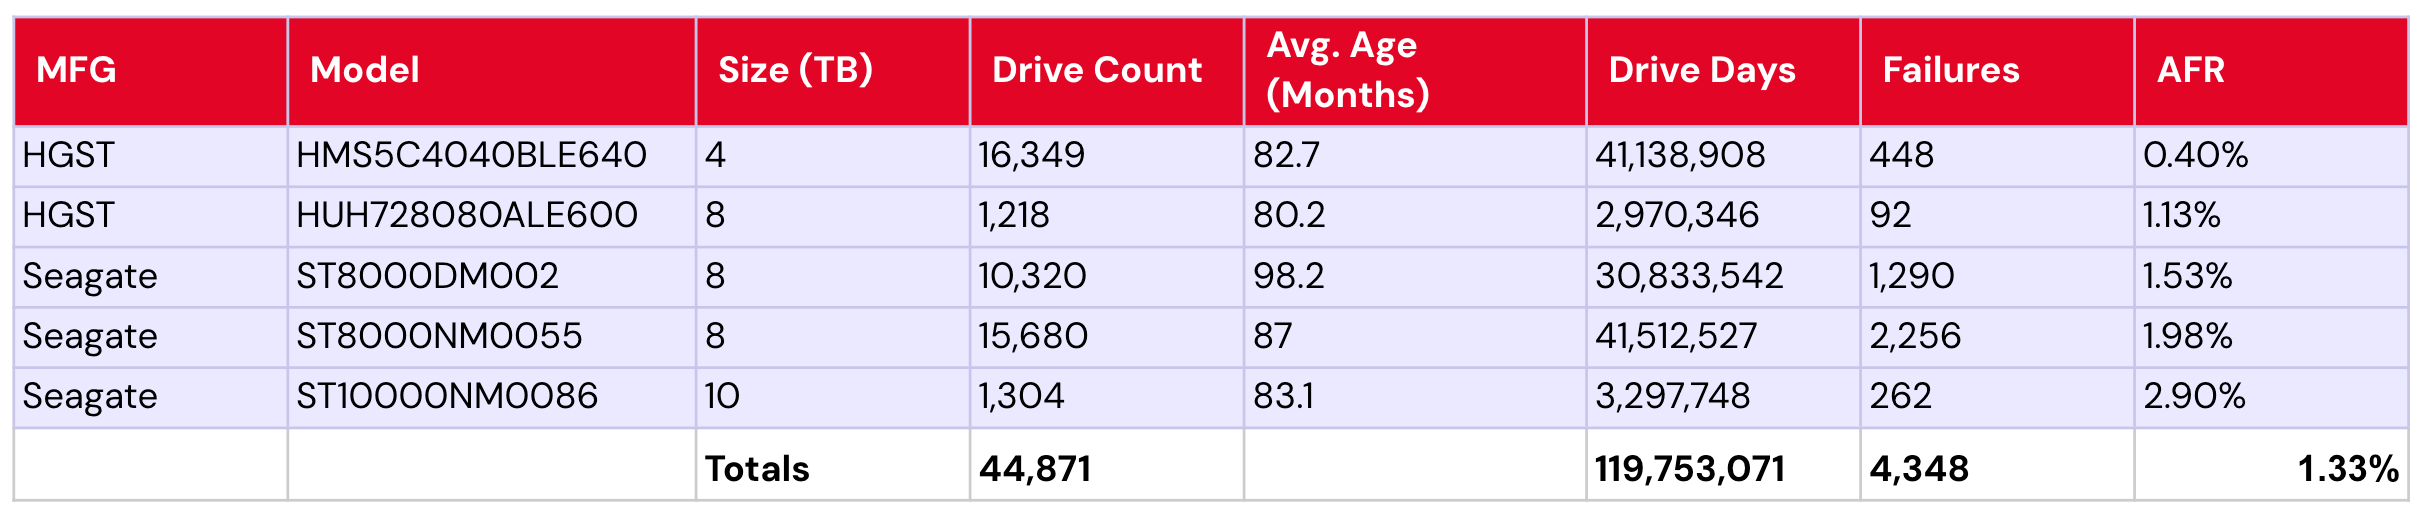
That said, it’s also perhaps more impressive that when we say “eight are five years and older,” of those eight drive models, five are six or more years old. Their collective AFR is 1.33%.
This begs the age-old question: Is age just a number? Or, are we just seeing several exceptional drive models? In any event—an interesting drive population to keep an eye on, as it represents 156,724 of our 393,907 (~40%) of the lifetime drive pool.
Zoom in: The 20TB+ club
We’ve been taking quick peeks at the 20TB+ drives in the last few reports, but it’s high time we dig in a bit deeper. Right now, our cohort of 20TB+ drives that meet the lifetime criteria consists of three drives, the 20TB Toshiba model MG10ACA20TE, 22TB WDC model WUH722222ALE6L4, and 24TB Seagate model ST24000NM002H. Quite neatly, that also gives us one per manufacturer, lending itself to something of a head-to-head comparison—though, of course, with the variability we see on a per-drive basis within the same manufacturer, we won’t over-index on lending it too much significance.
Let’s take a look at each.
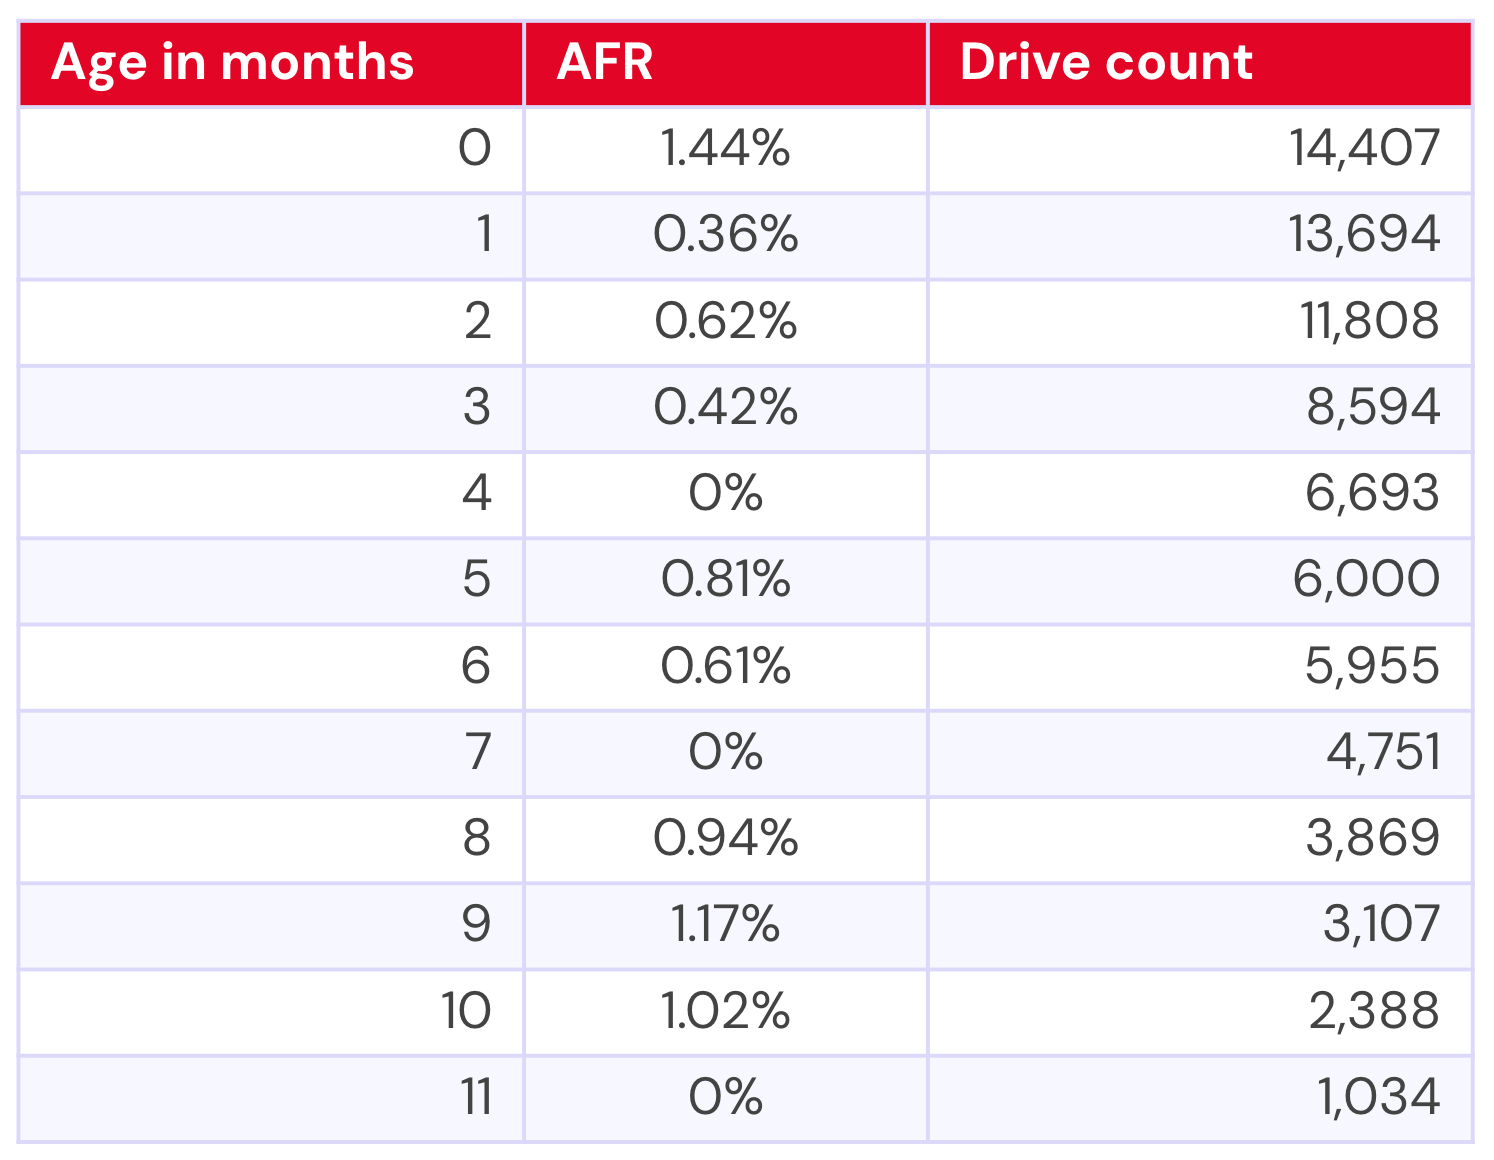
20TB Toshiba MG10ACA20TE
The Toshiba has actually been in our drive pool for 22 months, but until just under a year ago, there were only two drives. For the purposes of significance, then, we’ll exclude significantly low numbers of drives—thankfully, each model has something of a natural fall-off point where they go from single-digit drive numbers to hundreds.
For the Toshiba, that gives us the following data:
Converted to a graph, we end up with the following:
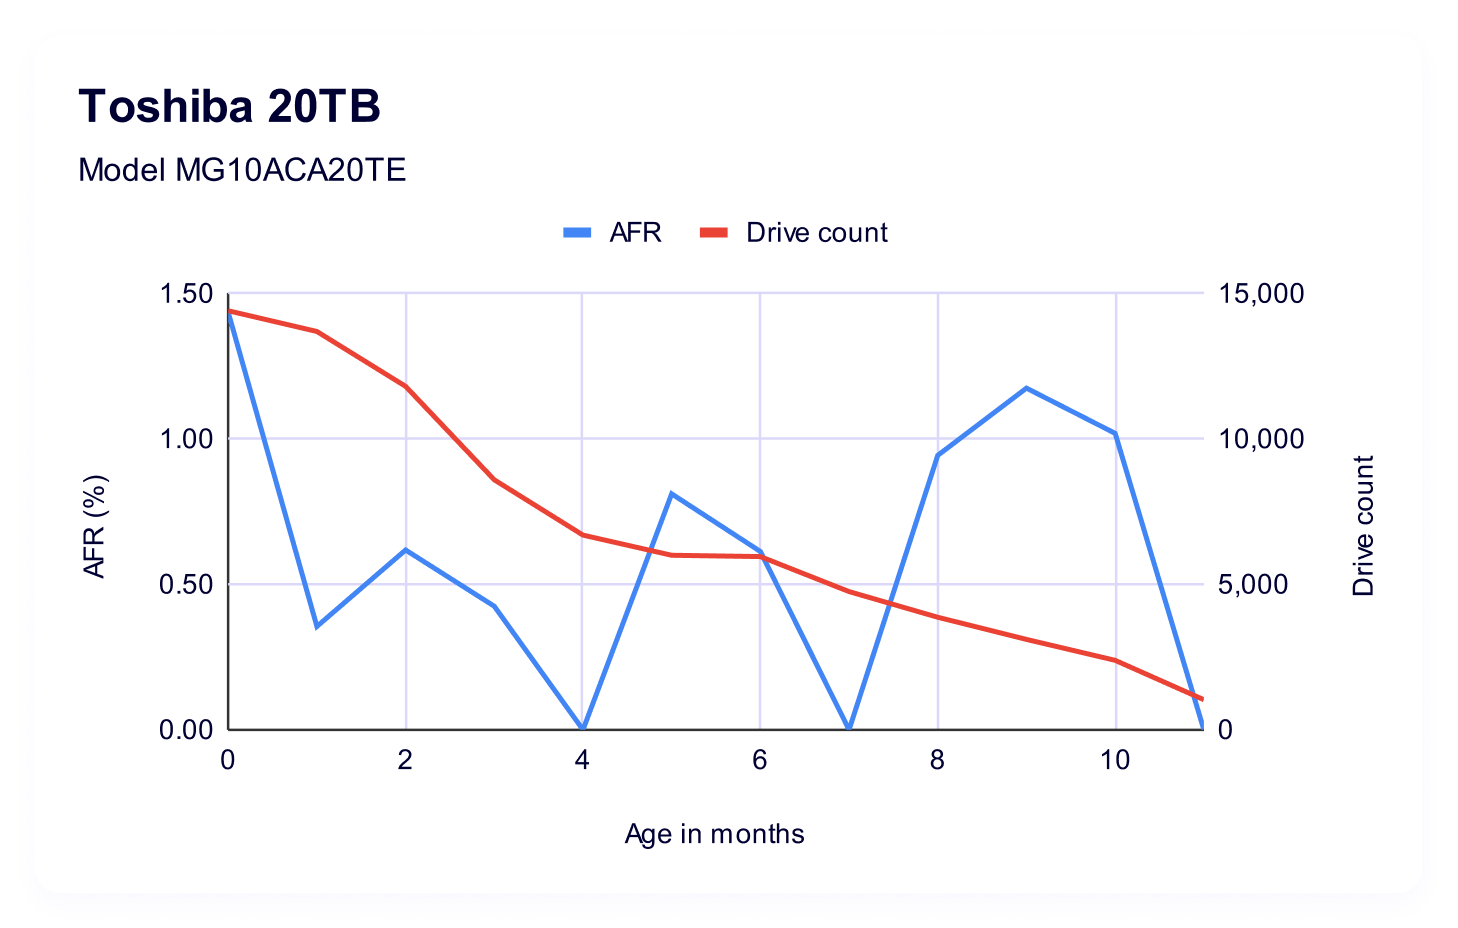
On this graph, the blue line represents the AFR and the red line represents the drive count. Drive count can be a bit tricky since our x-axis is age, and we start with age=0, which means that the drive count (from our perspective) goes from larger to smaller. That is, as drives get older, there are fewer of them by count—you have your initial purchase cohort, then you add drives over time. You can read this as the first data point representing drives that are between 0–1 month old, the next data point as 1–2 months old, etc.
We set it up this way because we wanted to be able to directly compare the failure rates of the drives based on their ages. Those familiar with our bathtub curve analysis may recognize our methodology here—we’re just zooming in on specific drives and drive capacities.
22TB WDC WUH722222ALE6L4
Now let’s take a look at the WDC model. We have usable data for about 21 months of its drive life:
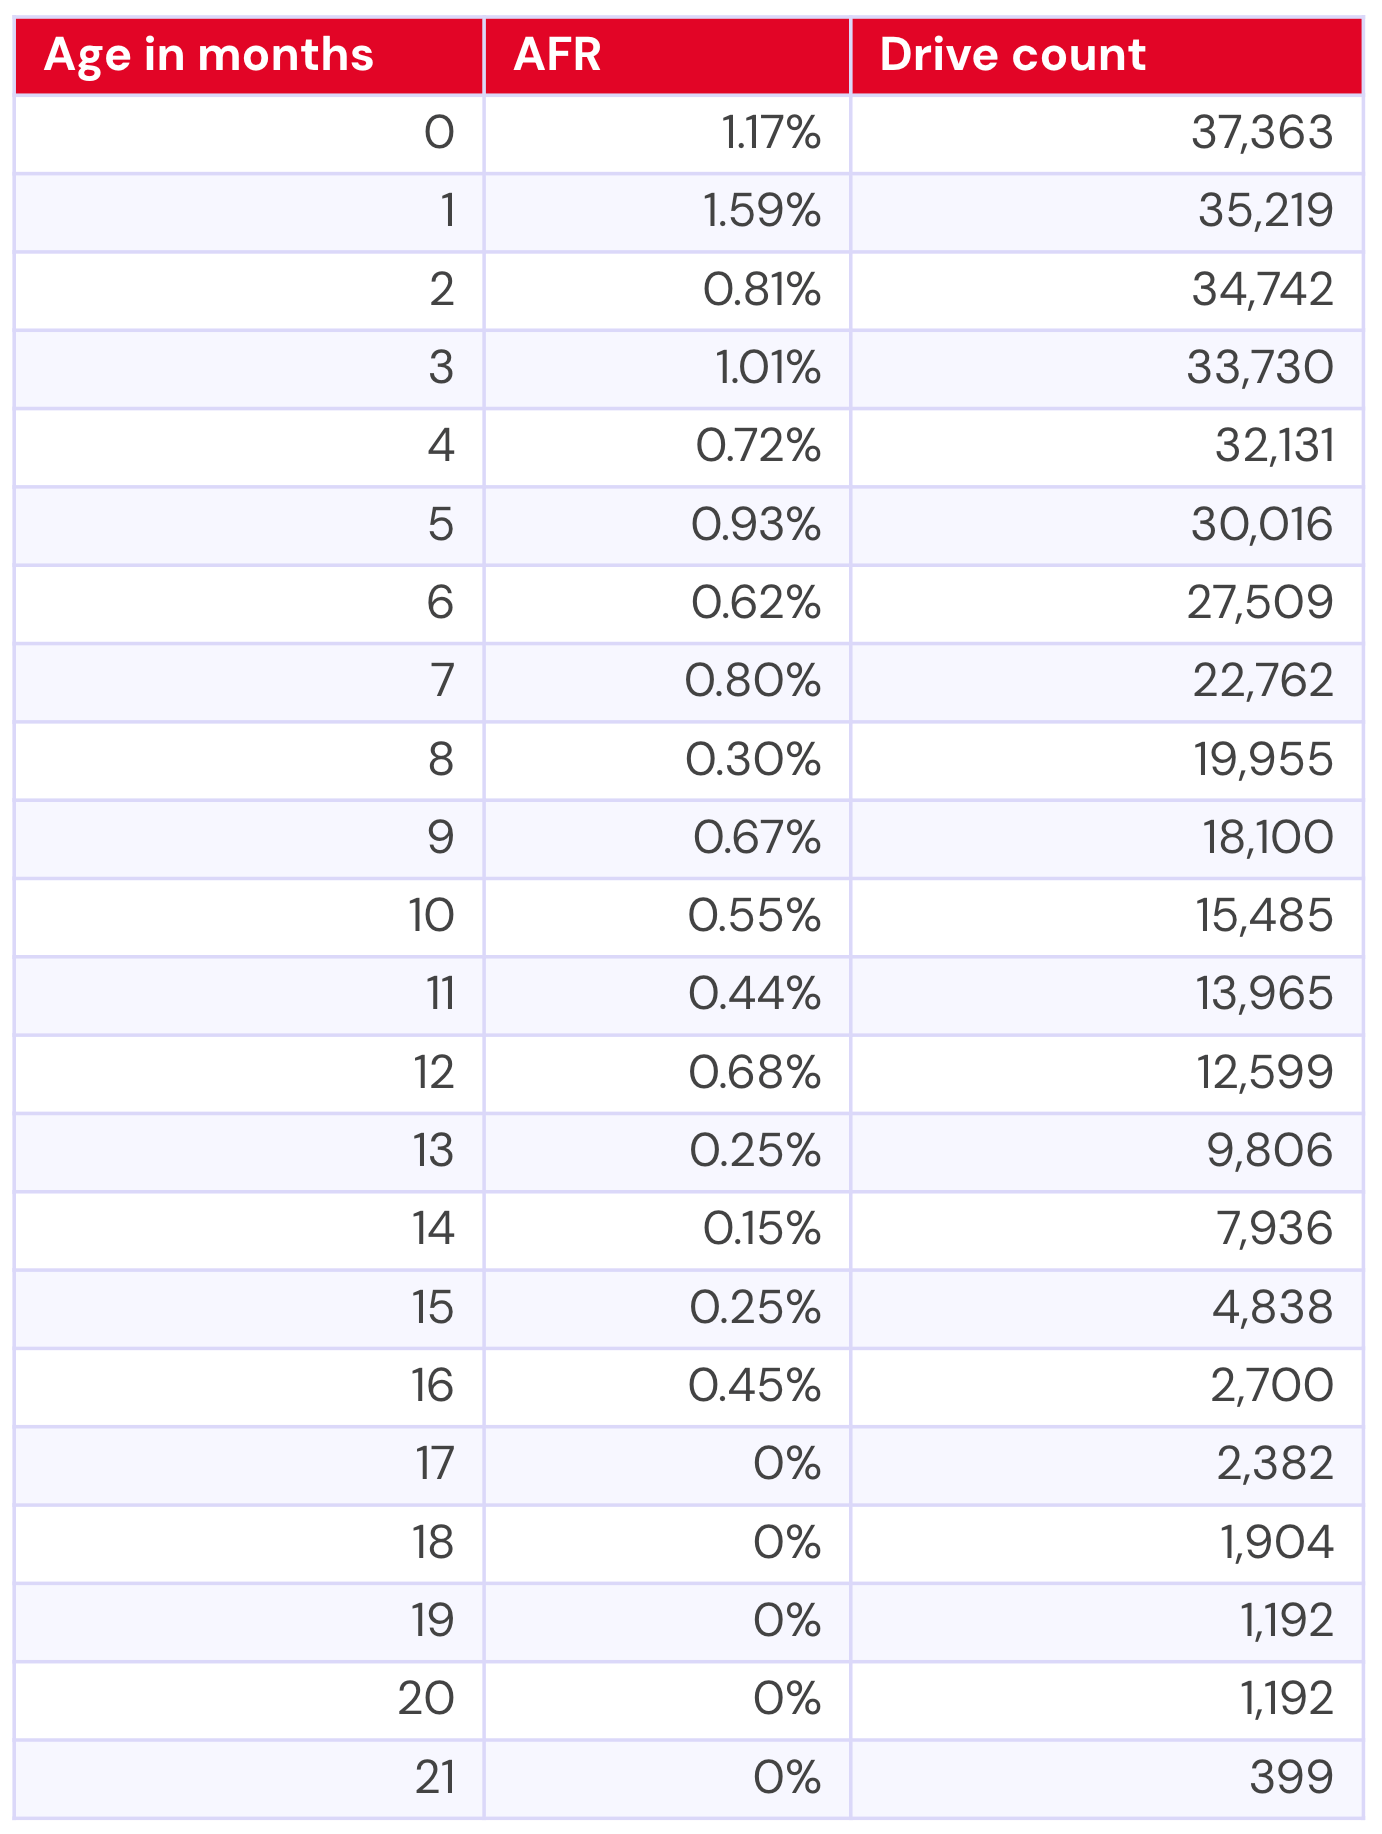
Which gives us the following visualization:
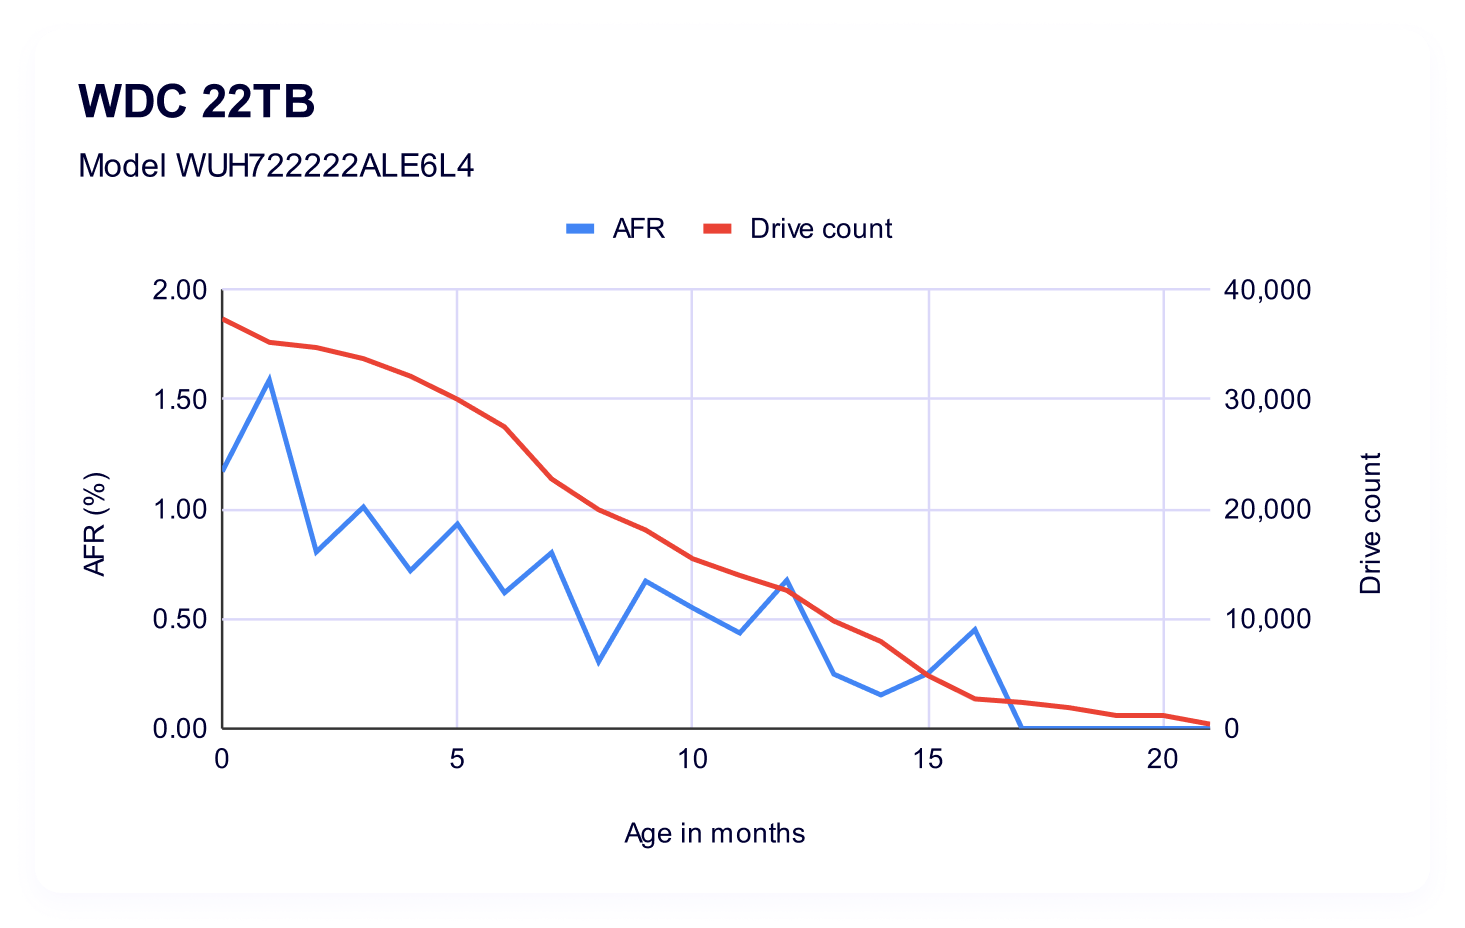
Interestingly, we see a lot less variability in the span of time where we have a direct comparison. That said, the WDC model also had a minimum of double the drive count if we’re looking at a similar time period—so, at their youngest (0 months old) the Toshiba had 14,407 drives vs. WDC’s 37,363; and, at 11 months Toshiba had 1,034 drives vs. WDC’s 13,965.
While AFRs do get us mostly on an even playing field as far as being able to make a 1:1 comparison, it’s important to remember that in smaller drive pools, a single failure can be amplified by quite a bit.
24TB Seagate ST24000NM002H
Our youngest drive model, the 24TB Seagate ST24000NM002H, has just half a year of data.
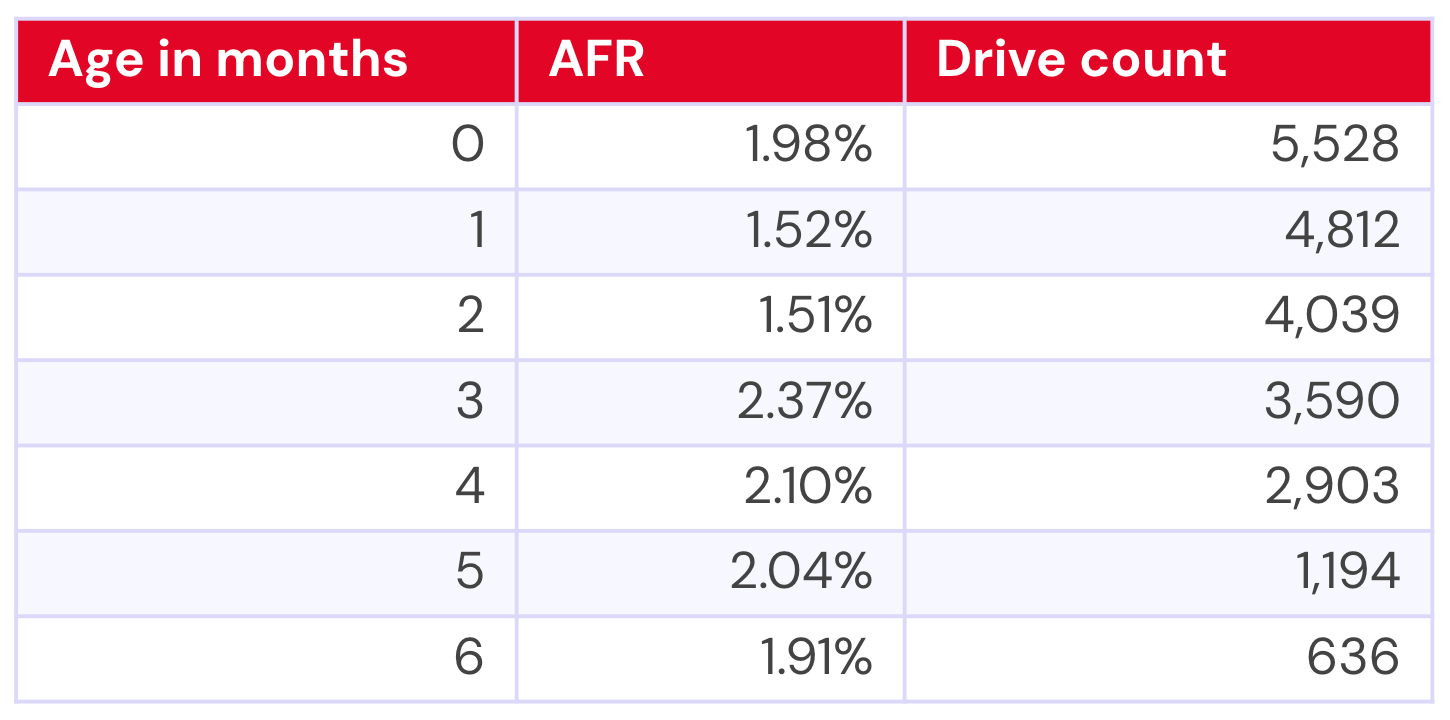
That gives us the following visualization:

Compared with our other two drive models, the 24TB Seagate definitely has the highest failure rates. This could be explained, in part, by it being a young drive—is it in the leading edge of a traditional bathtub curve? So, certainly something to track over time to see if it will settle out as it gets older.
All together now: Comparing each 20TB+ drives
We designed this view to be directly comparable at points in time, so, here’s your graph that puts each drive on the same time scale:
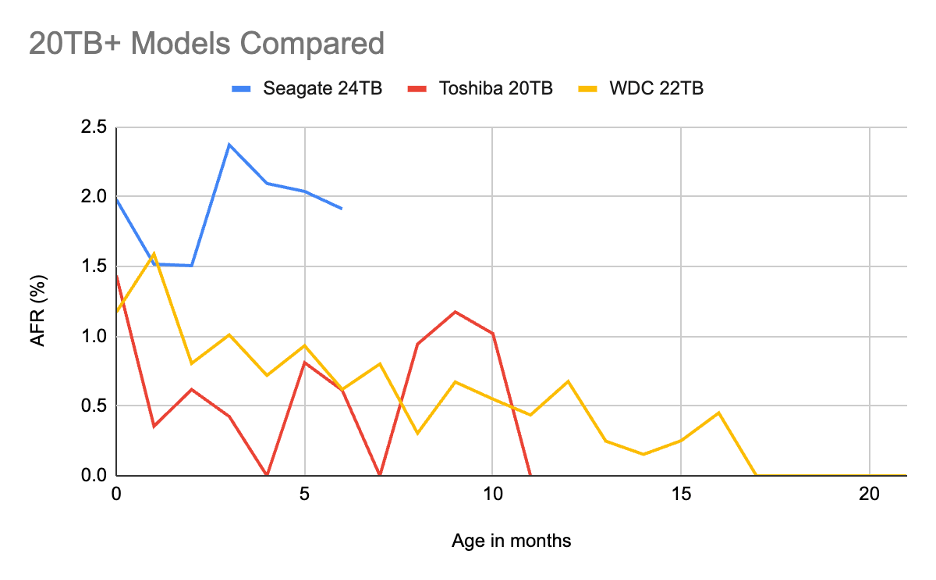
What’s our takeaway here? Well, in both drive count and length of time in the pool, it’s a little early to create definitive trends for the Seagate and the Toshiba. Certainly we can see that the Seagate is, early on, showing higher failure rates. Meanwhile, the 20TB Toshiba has had a bit of a variable year one. But again, with significantly variable drive pools between all models, we’re not quite comparing apples to apples. (We chose not to plot drive count on this chart—it gets messy quickly.) Add to that: the Seagate in particular is potentially at the beginning of the “bathtub” curve, we may see it change over time.
On the other hand, the 22TB WDC model has shown up quite a bit below our current average AFR for the drive pool of all drive sizes and ages, and it’s the model with the most data. But, how does that compare to other models as they come online?
Comparison: 20TB+ as a pool vs. 14-16TB as a pool
When we were considering whether this information would be a useful slice of the data, our biggest question was how to contextualize it versus drives. It’s perhaps a tad imperfect, but we landed on combining the 14–16TB drives as a pool, largely because they have a significant amount of data points and were our last set of drives onboarded, which means that they’re more or less the last generation of hardware.
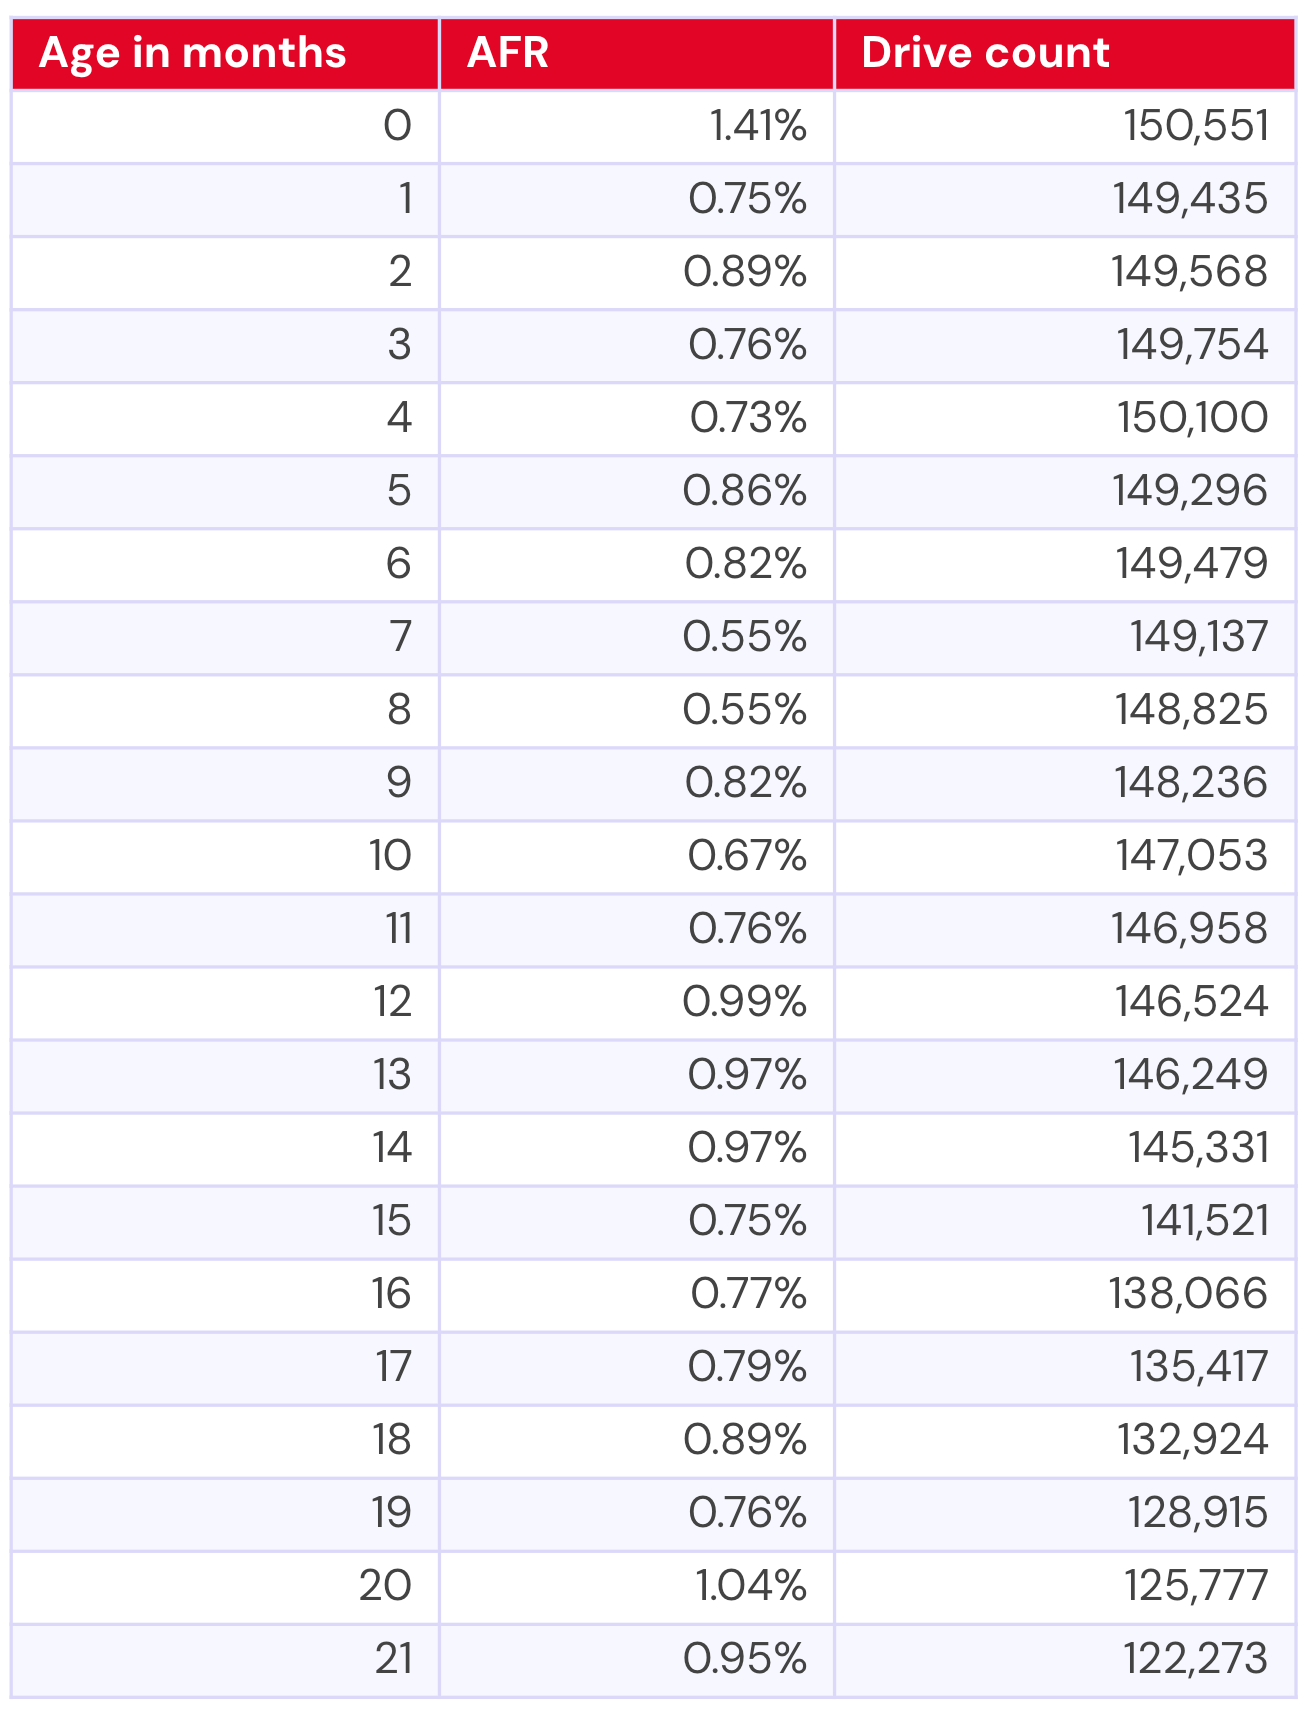
The other thing to note is that once we combined the 20TB drives into a pool, some of the data we filtered out on a per-drive basis got added back in. So, at the 21 month mark, where the Toshiba model only had one drive, we added that single drive to the 399 that our WDC model brought to the table and calculated AFR across the pool (giving us 400 drives to work with).
Here’s the numbers for the 20TB+ drive pool:
That gives us a pretty neat graph, actually:

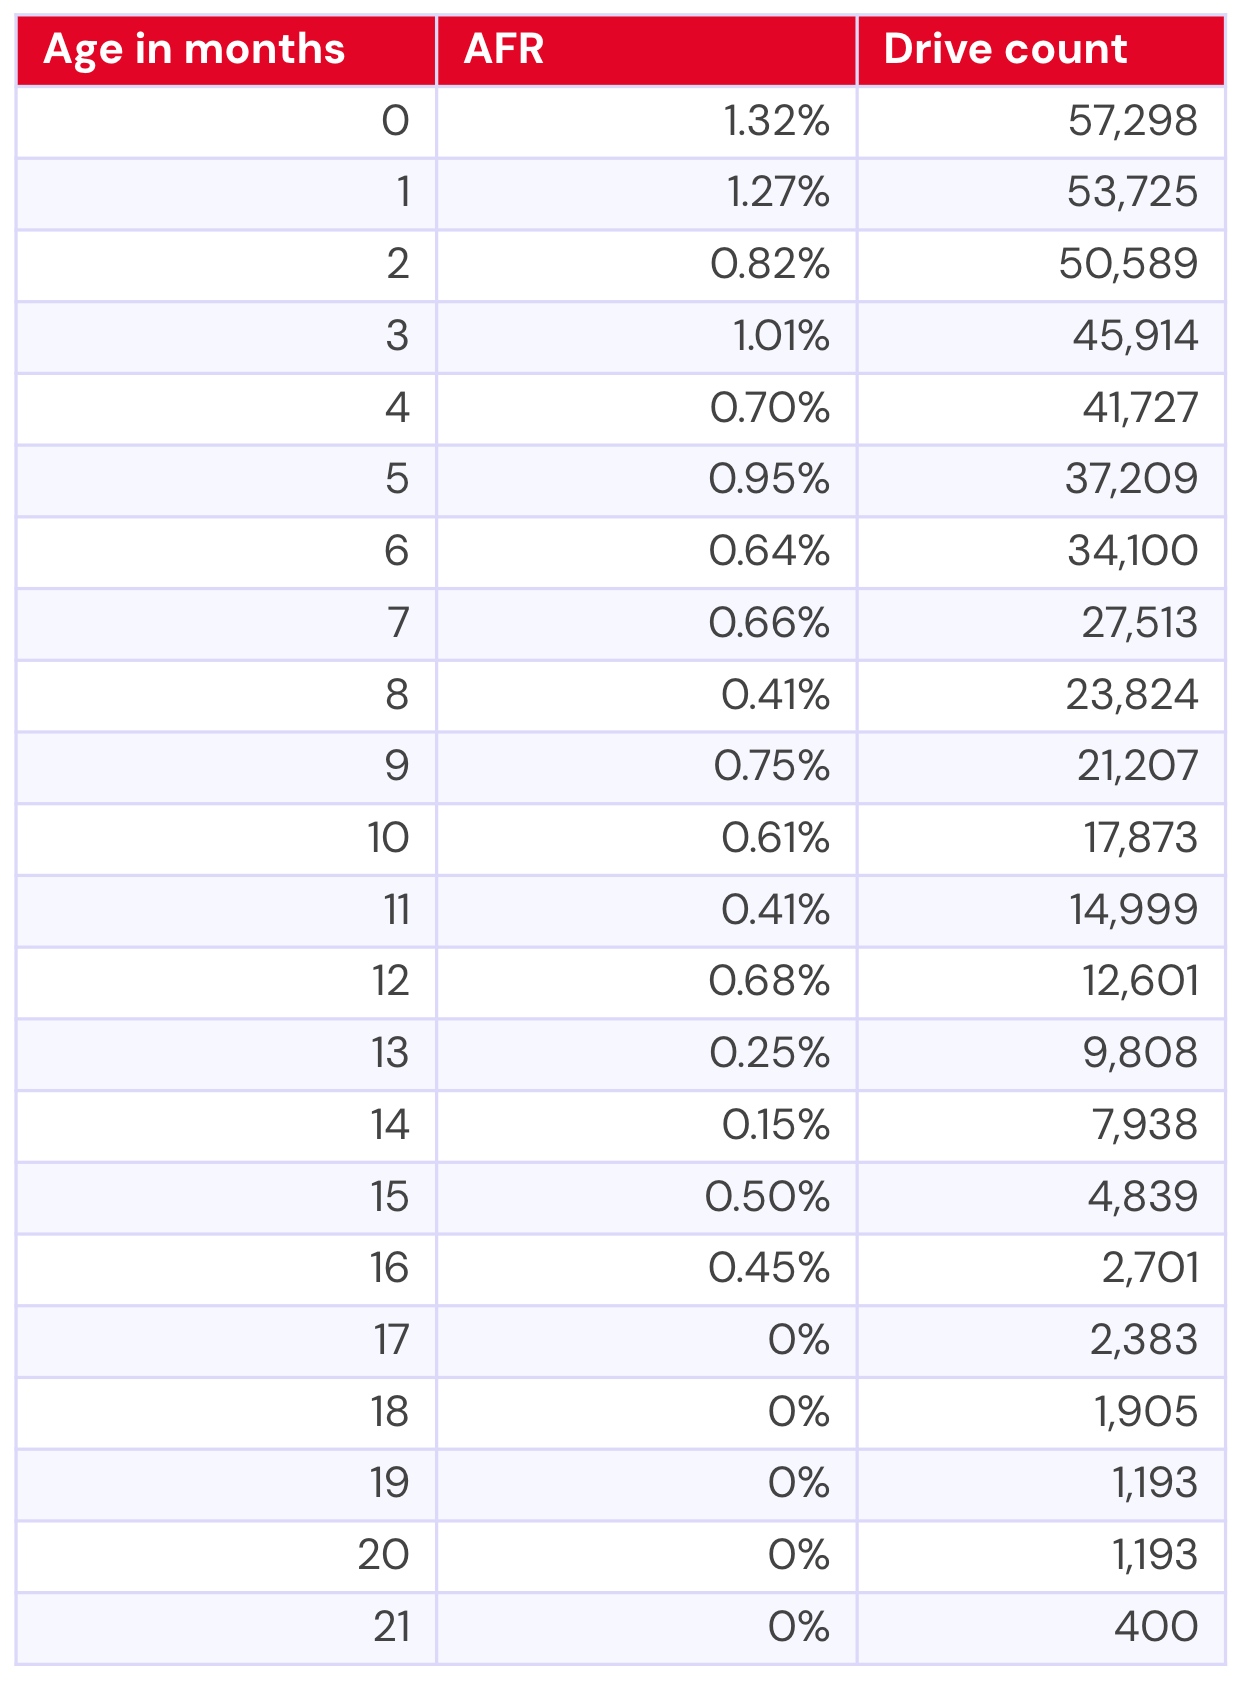
Now, let’s compare to the 14–16TB drives of the same age. We have significant data for this population for nearly seven years, but in the interest of saving you three pages of scrolling, I’ll give you the table for the data that directly correlates to the 21 months of data we have for the 20TB+ drives.
This is the line chart for that range of time:
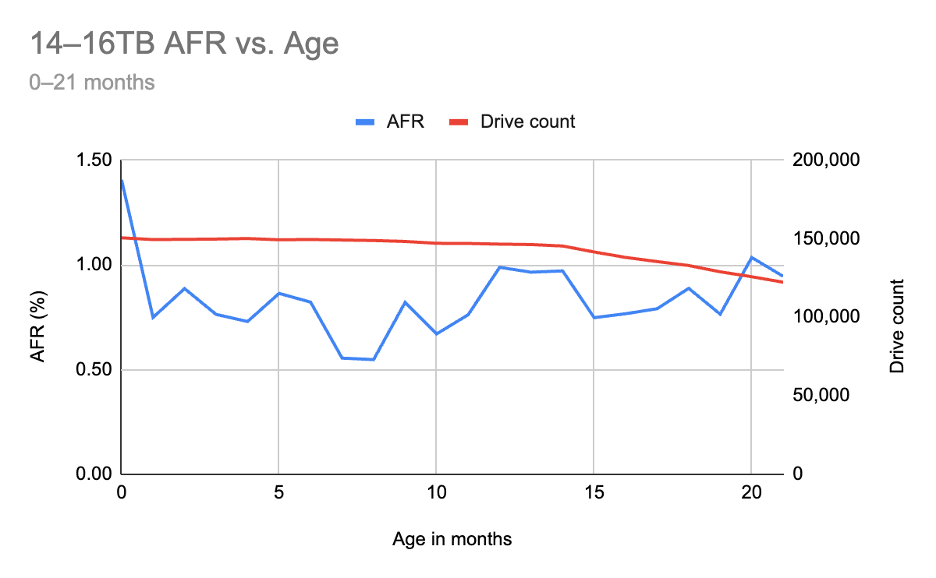
Comparing age of drive to age of drive, it would seem that our 20TB are right on target, and perhaps doing a bit better than expected. But, that definitely isn’t a perfect comparison given that the 14–16TB drives have a steadier and larger drive count. So, let’s look at the chart with the full, nearly seven year time period:
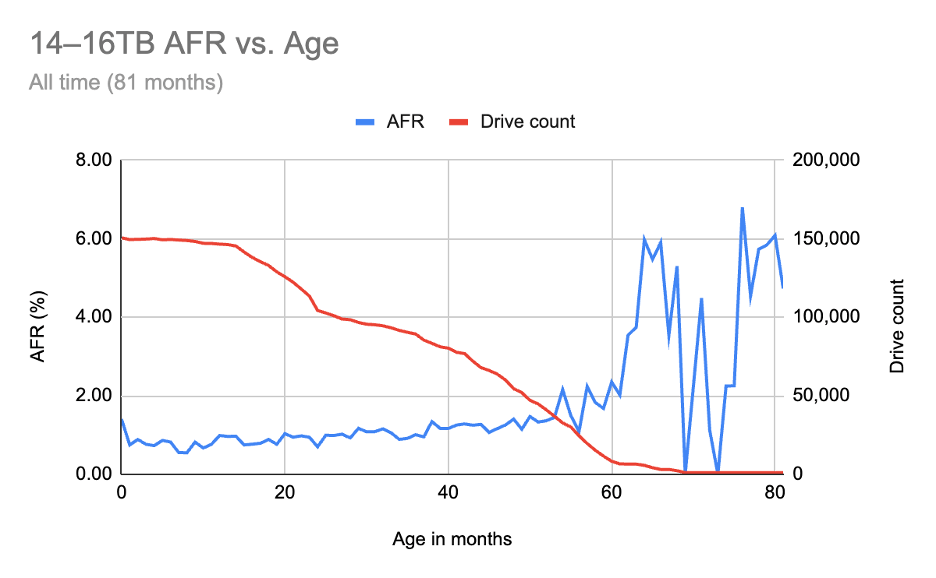
This view starts to show us some spiky patterns as the 14–16TB drives get older, of course exacerbated by drive counts reducing over time.
So what’s it all mean?
It’s clear from the data that we need to give the 20TB+ drives time to mature, and that as we (depending on our buying behavior, of course) add more drives, we might see some interesting changes in the data.
As for the 14–16TB pool, they’re following relatively expected patterns of wearing out in the five-plus year range—but what does that mean when you compare to what we observed in our current lifetime stats, where we see our 12TB and smaller drive pool performing so well?
Without taking a closer look at the 14–16TB drives, it’s hard to say that they don’t have similar outlier tendencies to what the 12TB and smaller pool does, just pulling the failure rates upward. Even a casual glance at our current lifetime table’s 14–16TB drives bears that out (four years and older highlighted in orange, as our corollary above):
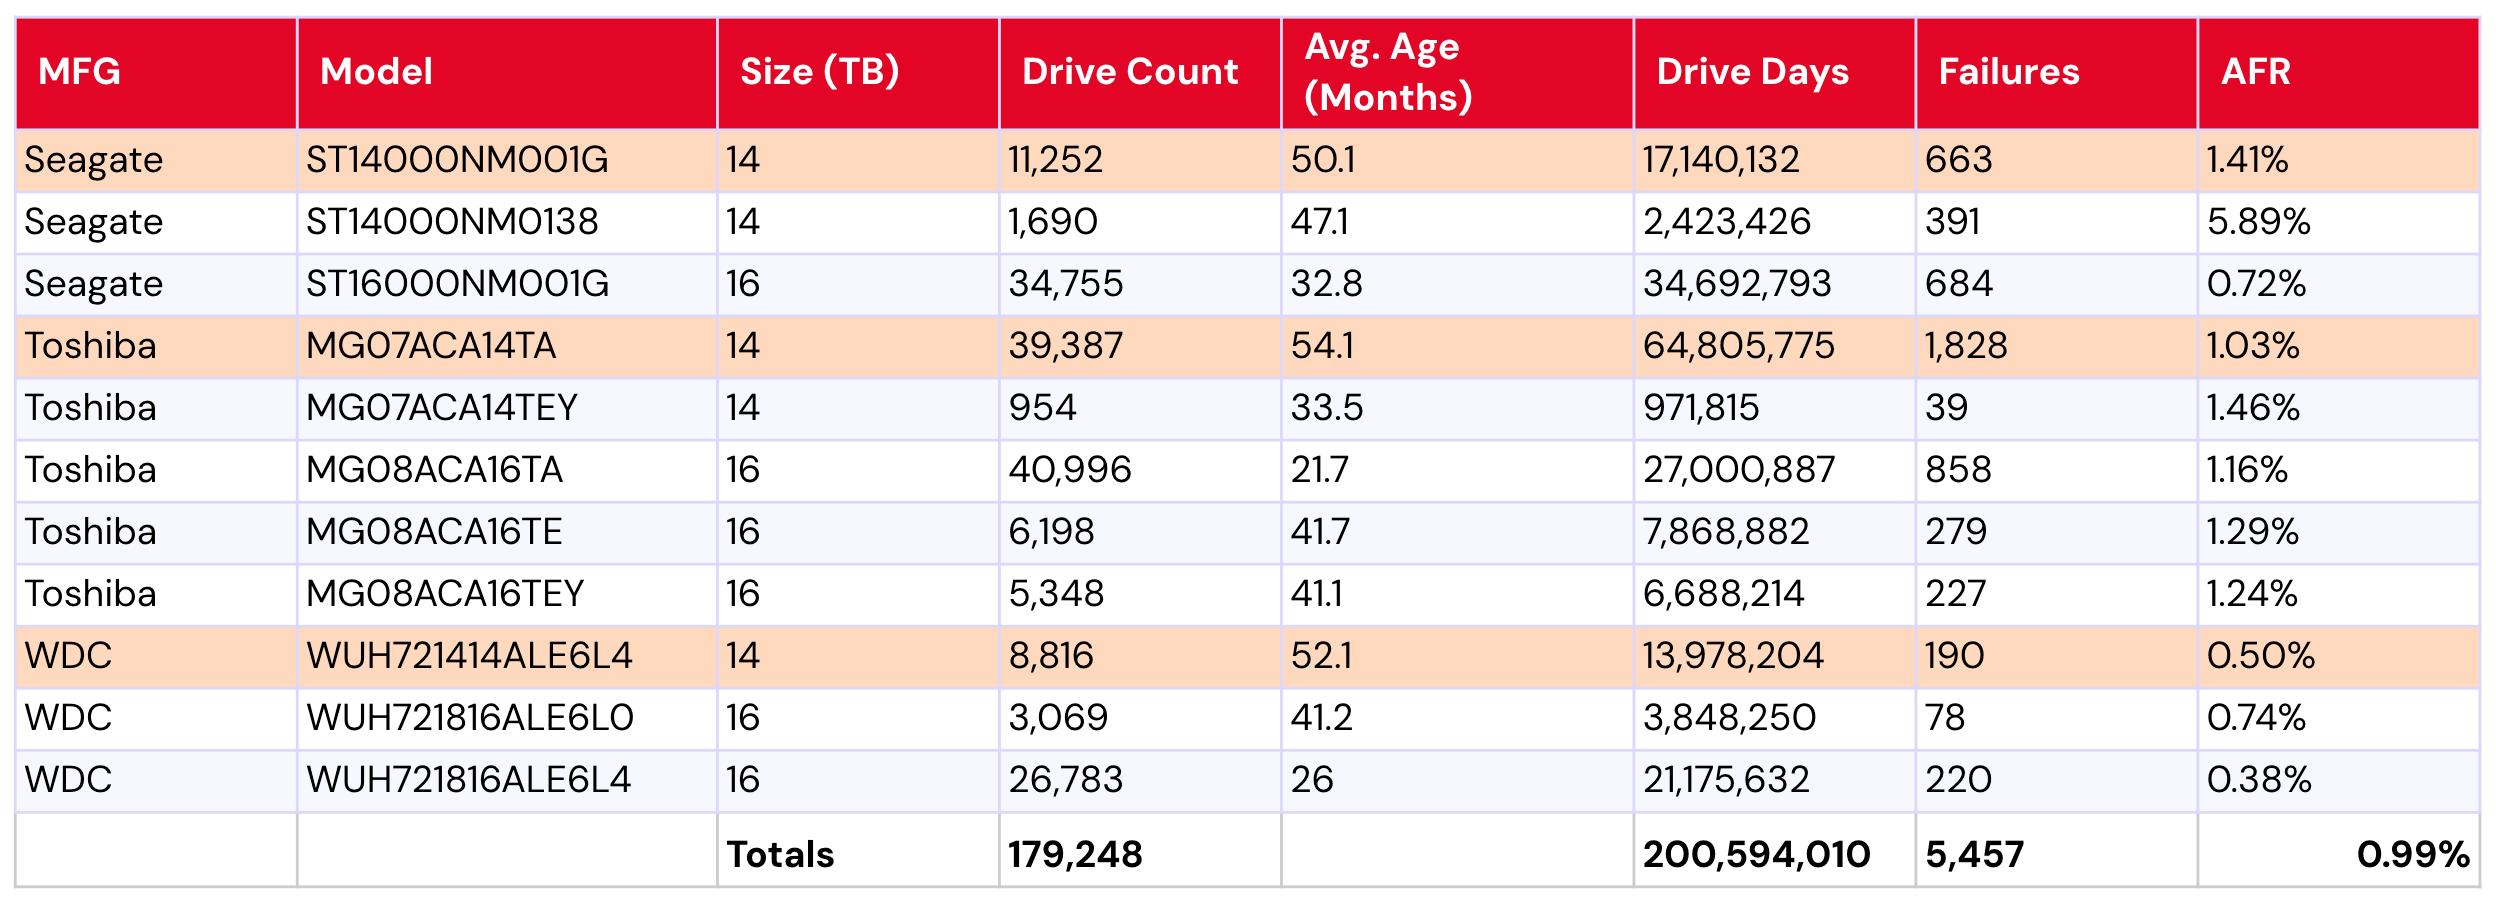
That data isn’t inclusive of all of the 14–16TB drives we’ve ever had, though—just those currently in operation. So, as always, there’s more investigation to be done.
The Hard Drive Stats data
The complete dataset used to create the tables and charts in this report is available on our Hard Drive Test Data page. You can download and use this data for free for your own purpose. All we ask are three things: 1) you cite Backblaze as the source if you use the data, 2) you accept that you are solely responsible for how you use the data, and 3) you do not sell this data itself to anyone; it is free.
Good luck, and let us know if you find anything interesting.