
This year marks 13 years of collecting Drive Stats data. Thirteen is an unlucky number (to some), but we count our lucky stars (or perhaps our lucky stats?) that we’ve had 13 years of this experiment.
The traditional 13-year anniversary gift is lace—intricate, impressive, and vulnerable to a snag if you don’t plan ahead to protect the pattern. Systems, like lace, don’t survive by pretending there are no points of vulnerability. When it comes to our infrastructure, we want to build with the snags in mind to create something durable, and the Drive Stats series is always seeking to publish and provide data so that you, too, can go the distance with your drives.
This year-end Drive Stats report looks at Q4 2025, the full year, and the lifetime view with that in mind. I think you’ll find the same things we do: over time, the patterns matter more than any single strand (or drive, to run this lace metaphor into the ground once and for all). Let’s look at the stats.
Drive Stats is here for you
Drive Stats is not a situationship. We’re a conversation and a relationship—to the data. Join the Drive Stats team for our regularly scheduled webinar to walk through the 2025 annualized failure rates, break down the data for interesting trends, and get the latest from the Backblaze drive fleet happenings.
Drive Stats: The digest version
Q4 2025 hard drive failure rates
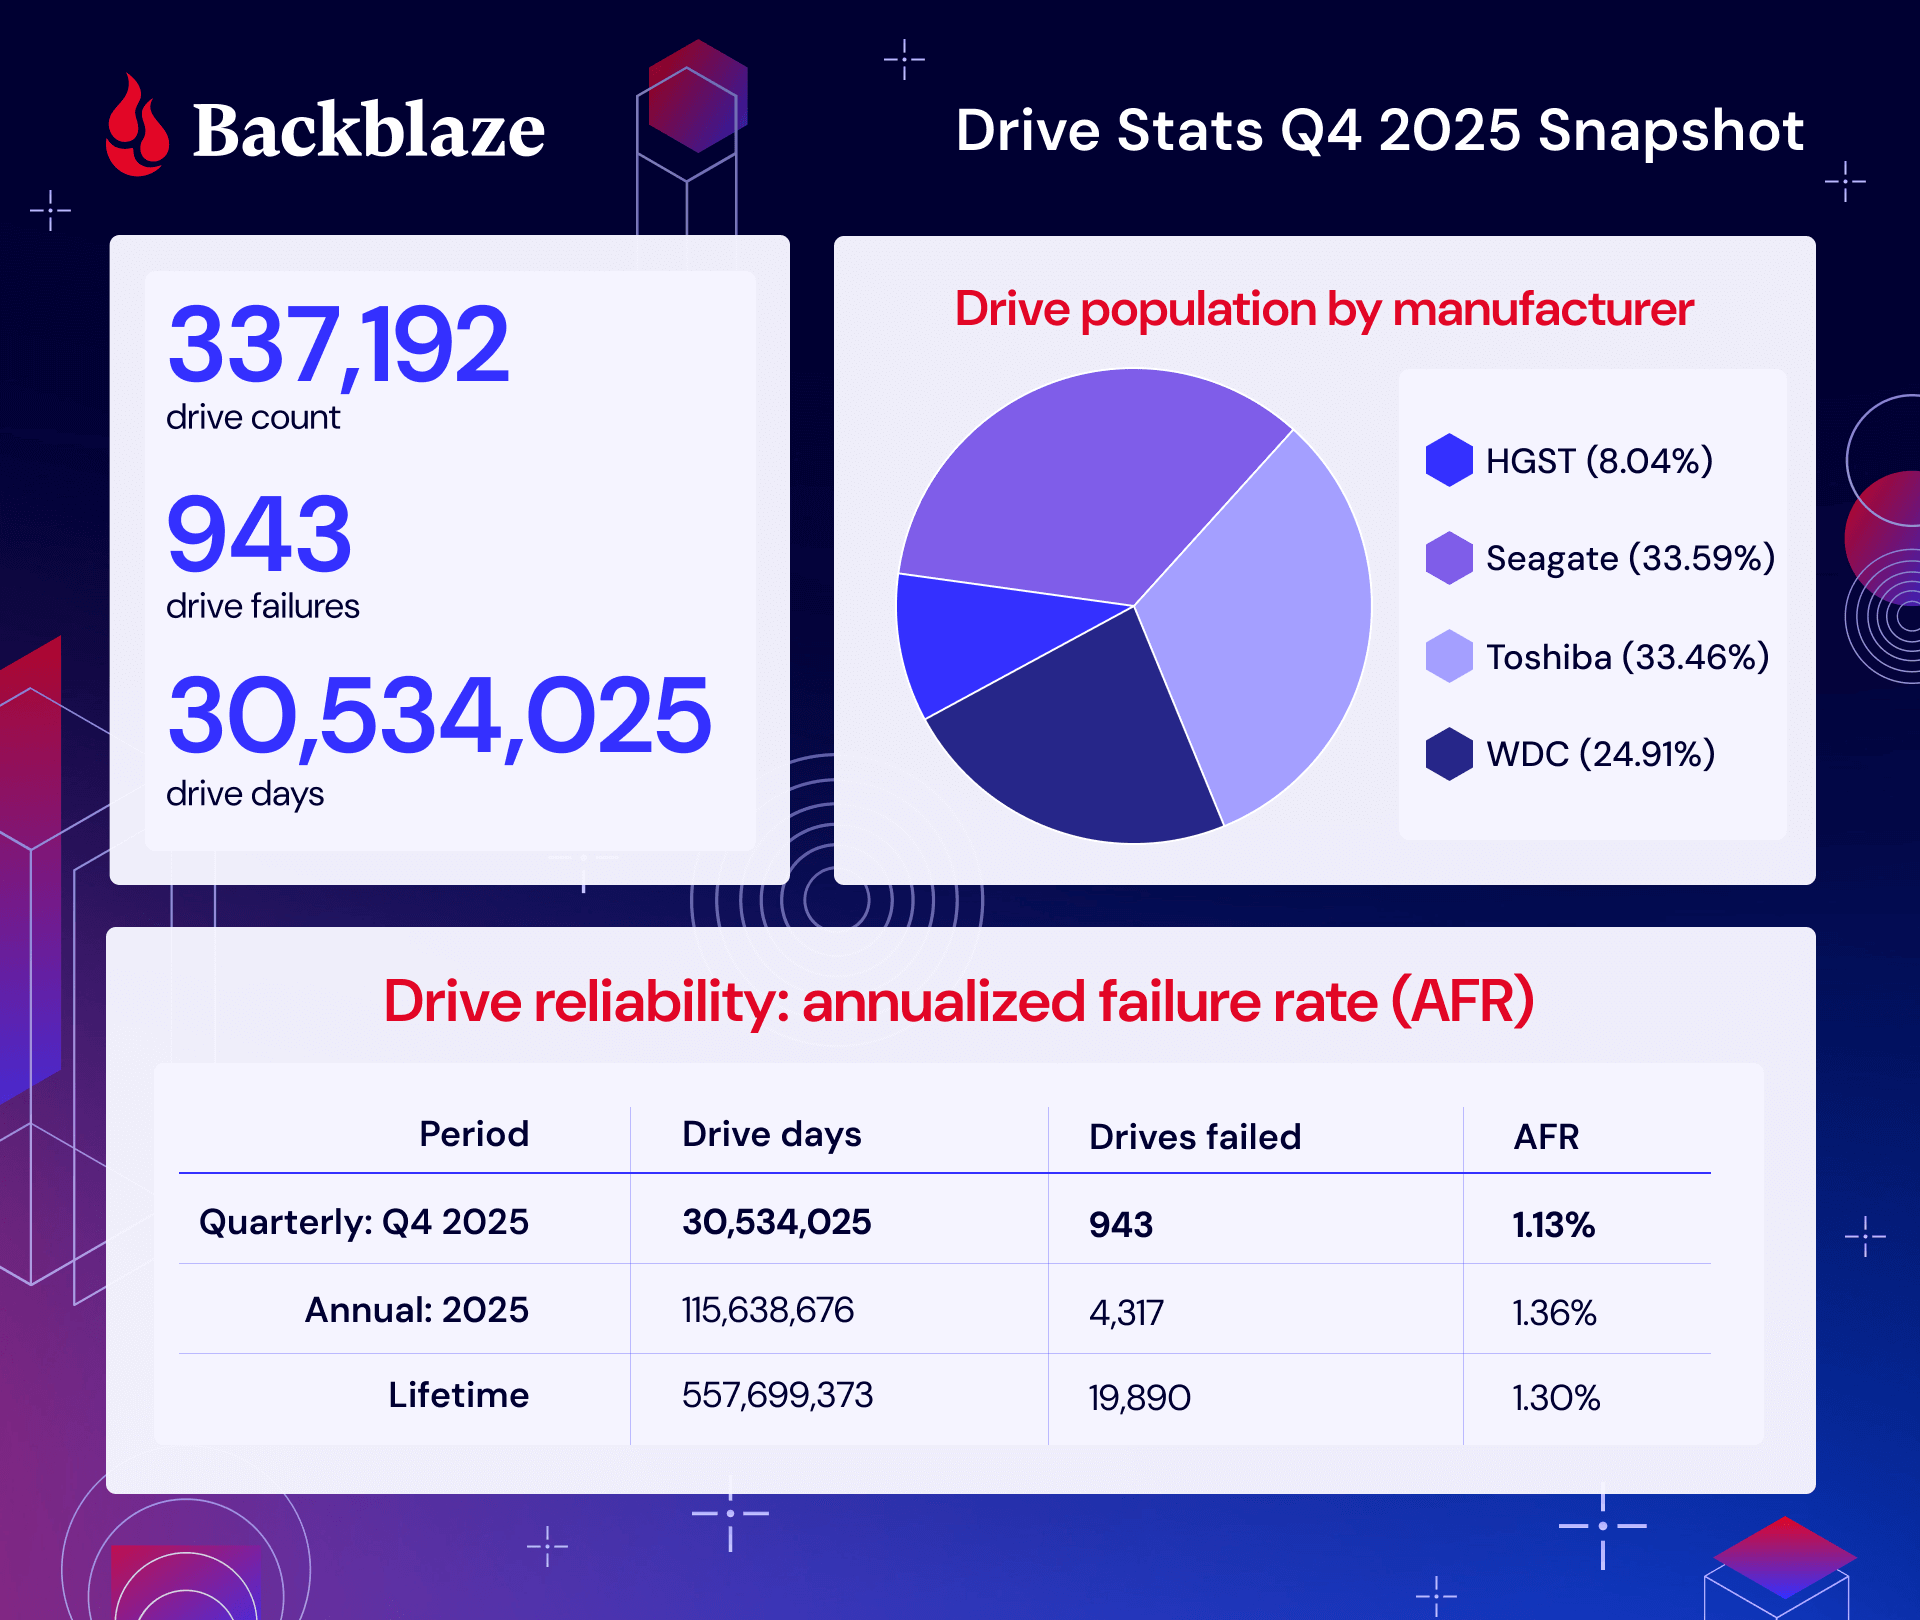
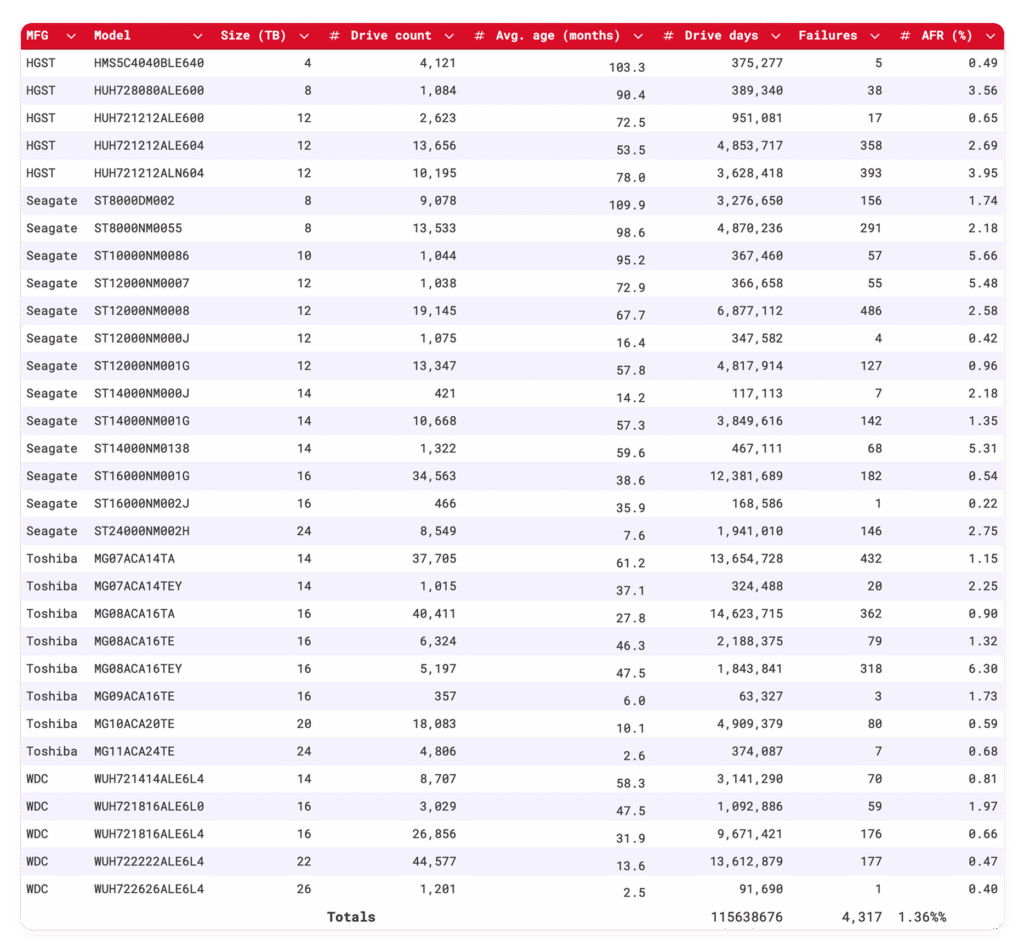
As of the end of 2025, Backblaze was monitoring 341,664 drives used to store data. For our evaluation, we removed from consideration 4,013 boot drives and 459 hard drives, as they did not meet the criteria to be included. We’ll discuss the criteria we used in the next section of this report. Removing these drives leaves us with 337,192 hard drives to analyze. The table below shows the annualized failure rates for Q4 2025 for this collection of drives.
Backblaze Hard Drive Failure Rates for Q4 2025
Reporting period October 1, 2025–December 31, 2025 inclusive
Drive models with drive count > 100 as of December 31, 2025 and drive days > 10,000 in Q4 2025.

Note and observations
- New drives!
- Seagate ST16000NM000J 16TB, with 112 drives
- WDC WUH722626ALE6L4 26TB with 1,201 drives. Our first 26TB drive!
- The honor roll:
- HGST HMS5C4040BLE640 4TB: 1 failure
- Seagate ST8000NM000A 8TB: 0 failure
- Seagate ST12000NM000J 12TB: 1 failure
- Seagate ST16000NM000J 16TB: 1 failure
- Seagate ST16000NM002J 16TB: 0 failure
- WDC WUH722626ALE6L4 26TB: 1 failure. Shoutout to the new kid—starting off strong!
- Red flags:
- HGST HUH728080ALE600 8TB: 10.29%
- Seagate ST10000NM0086 10TB: 5.23%
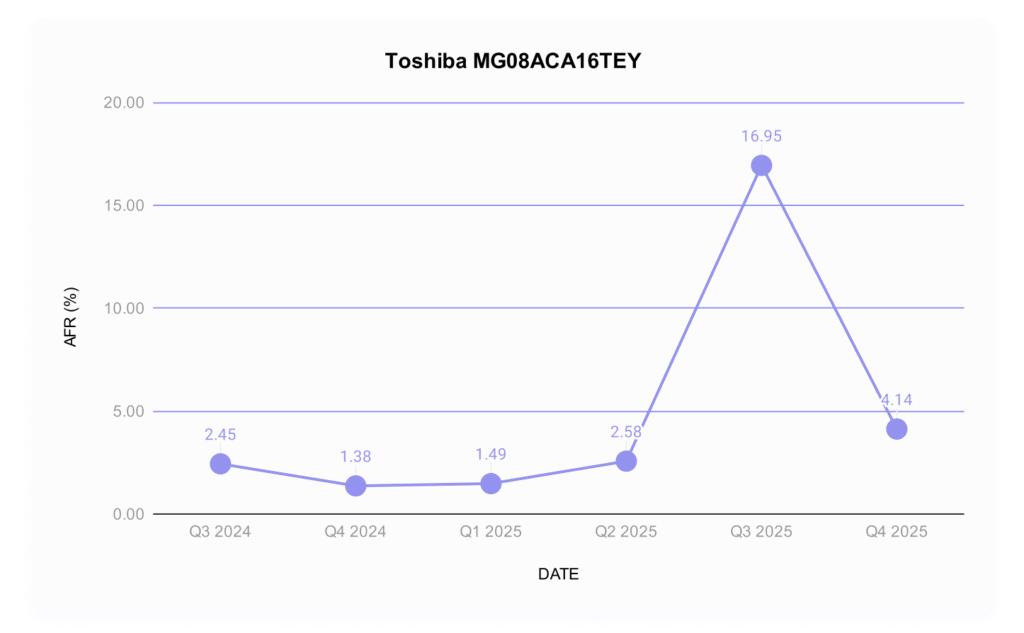
- Toshiba MG08ACA16TEY 16TB: 4.14%
We talked about two of these drives last quarter, and what we said about the Seagate still holds true—we’re seeing end of life activity with this drive. But, let’s dig in on the 8TB HGST and 16TB Toshiba and see what’s going on.
HGST HUH728080ALE600 8TB
There’s always some digging to be done when we see a double digit failure rate, especially on a drive that, in the past year, hasn’t had terrible failure rates (despite the fact that it’s about 7.5 years old).
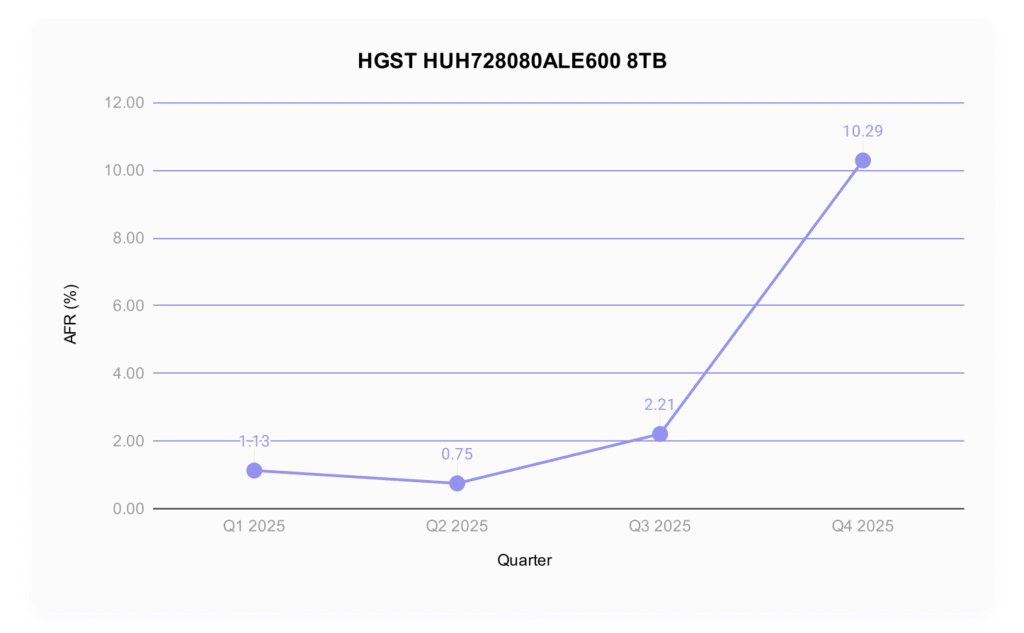
It’s worth contextualizing, first, that the total drive count of this model is 1,073, which equates to less than one Vault. (A standard Vault has 1,200 drives.) While Vaults aren’t always the same drive model, especially with older drives, in an ideal world, those Vaults would be uniform. So, in this case, we’re dealing with drives that are all hanging out in the same location in a data center, which means we could be working with environmental factors like a change in temperature or airflow.
By the time Drive Stats data gets to me, of course, lots of smart people have already seen the disturbances in the force, so to speak. When I dug into the data center work tickets, it turned turned out that folks had already ruled out temperature as a factor—the working theory at the moment is that the drive could be sensitive to vibration, but given the age of these drives, we decided to just flag them for our normal CVT migration process.
Toshiba MG08ACA16TEY 16TB
We talked about this model last quarter because it clocked in at a 16.95% AFR (!!). Our investigation turned up some collaborative (and routine) firmware work with Toshiba, and at that time, we predicted that these failure rates would normalize once again. We’re still a little high, but that’s likely a function of rolling out the work. As predicted, this is a healthy normalization.
Defining the relationship, aka setting some boundaries
We’ve covered the reasons that we’ve designed these exclusions in past reports, but here’s the quick and dirty:
| Period | Drive Count | Drive Days |
|---|---|---|
| Quarterly | > 100 | > 10,000 |
| Annual | > 250 | > 50,000 |
| Lifetime | > 500 | >100,000 |
Regardless of whether or not a given drive model is included in this article’s charts and tables, all of the line item data is included in our Drive Stats dataset which you can download by visiting our Drive Stats page.

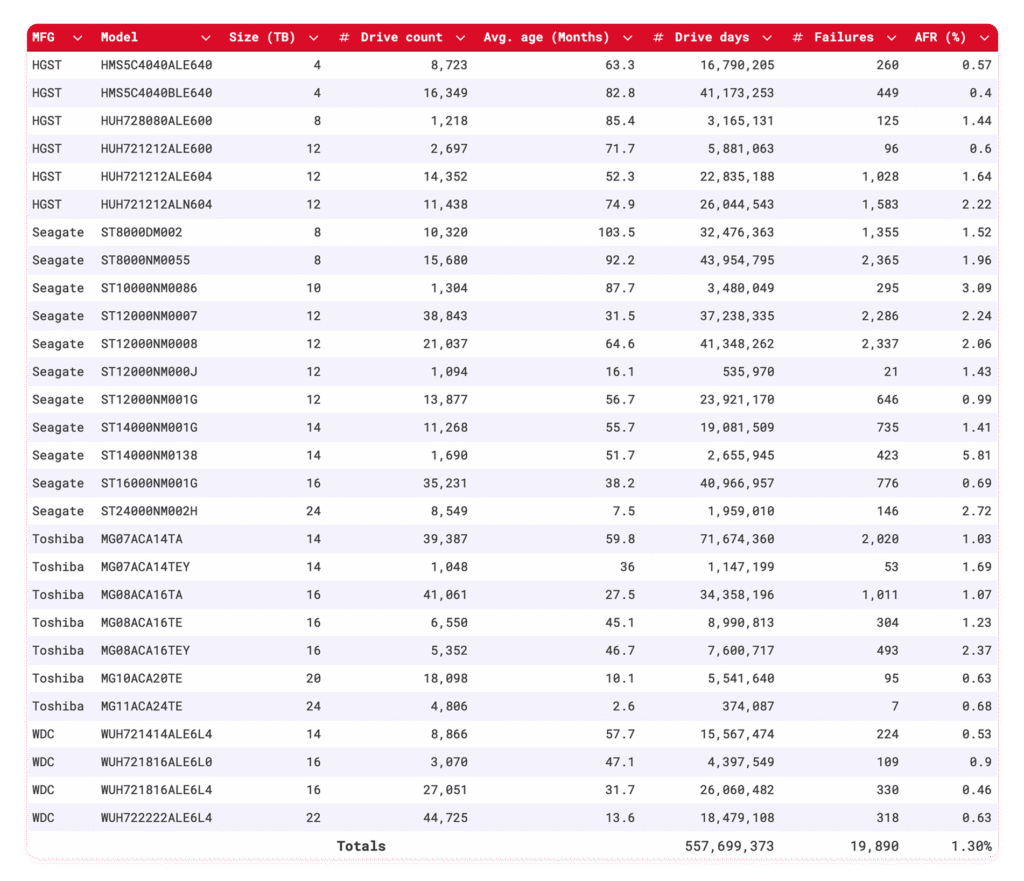
2025 Annual hard drive failure rates
As of the end of 2025, Backblaze was monitoring 349,462 hard drives used to store data. We removed 4,176 boot drives and 1,090 hard drives from consideration as they did not meet the annual criteria we have defined. This leaves us with 344,196 drives divided across 30 different drive models. The table below shows the AFRs for 2025 for this collection of drives.
Backblaze Hard Drive Failure Rates for 2025
Reporting period January 1, 2025–December 31, 2025 inclusive
Drive models with drive count > 250 and drive days > 50,000 in 2025
Notes and observations
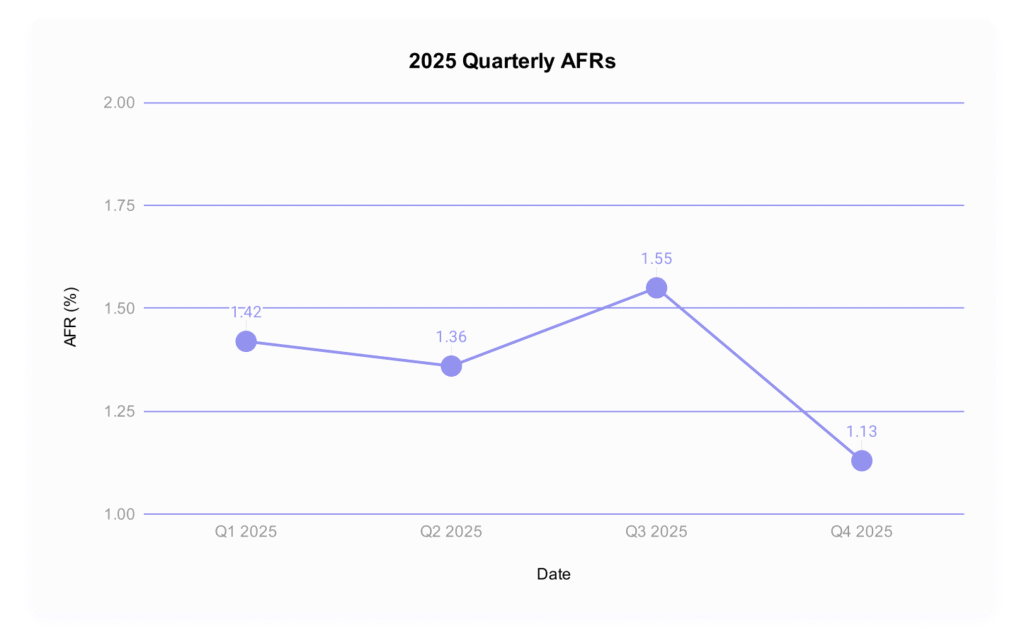
- The annual AFR is down: This year finishes strong at 1.36%, down from 1.55% in 2024. Still those paying attention to the quarterly AFR have seen some volatility in that number.
- Nobody made it out unscathed: There are zero 0 failures.
- But, let’s talk about it: These are the drives that averaged less than two failures per quarter (though, not necessarily evenly distributed when you look at the data).
- HGST HMS5C4040BLE640 4TB: 5 failures
- Seagate ST12000NM000J 12TB: 4 failures
- Seagate ST14000NM000J 14TB: 7 failures
- Seagate ST16000NM002J 16TB: 1 failure
- Toshiba MG09ACA16TE 16TB: 3 failures
- WDC WUH722626ALE6L4 26TB: 1 failures.
- Note that this drive is in its first quarter of life, so it’s hard to call this significant yet.
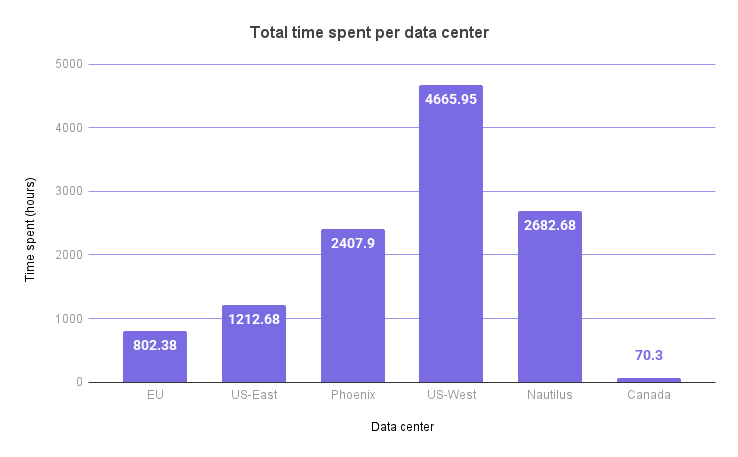
And, all those drive tickets and models mean lots and lots of work—we wrote a whole article on that front, but here’s a breakdown of hours spent in each data center.
And here’s an even more interesting slice, from a drive perspective:
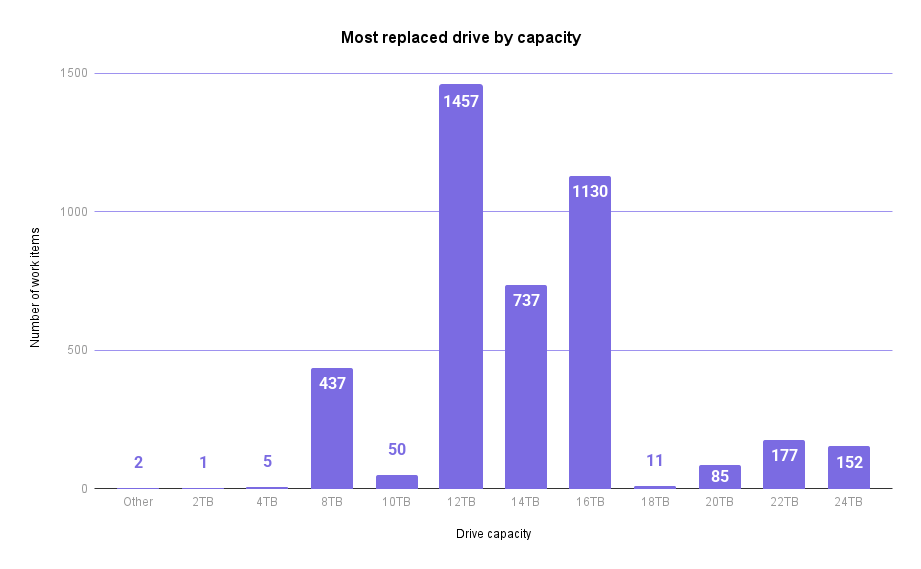
Yes, you’ll see some funky drive sizes on that list; it’s inclusive of all of our drives, not just the hard drives we include in this report.
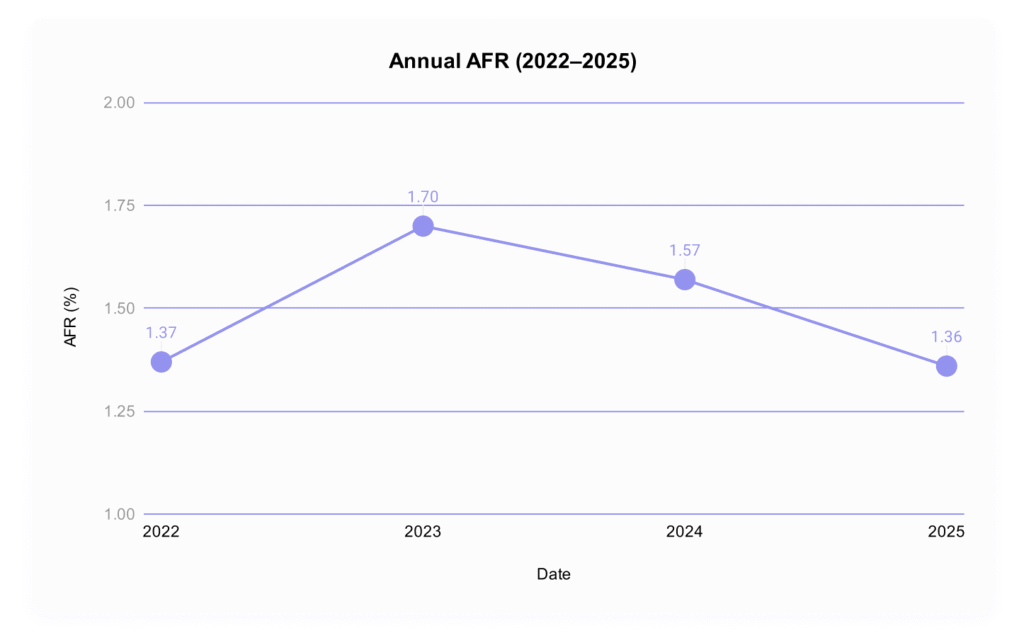
Comparing Drive Stats for 2023, 2024, and 2025
Let’s take a look back at the previous years’ annual AFRs to get a sense of how 2025 compares:
Three Year Comparison of Annual Backblaze Hard Drive Failure Rates
For drive models with > 250 drives as of 12/31/25 and drive models with > 50,000 drive days in 2025
Data for each year is inclusive of that year.
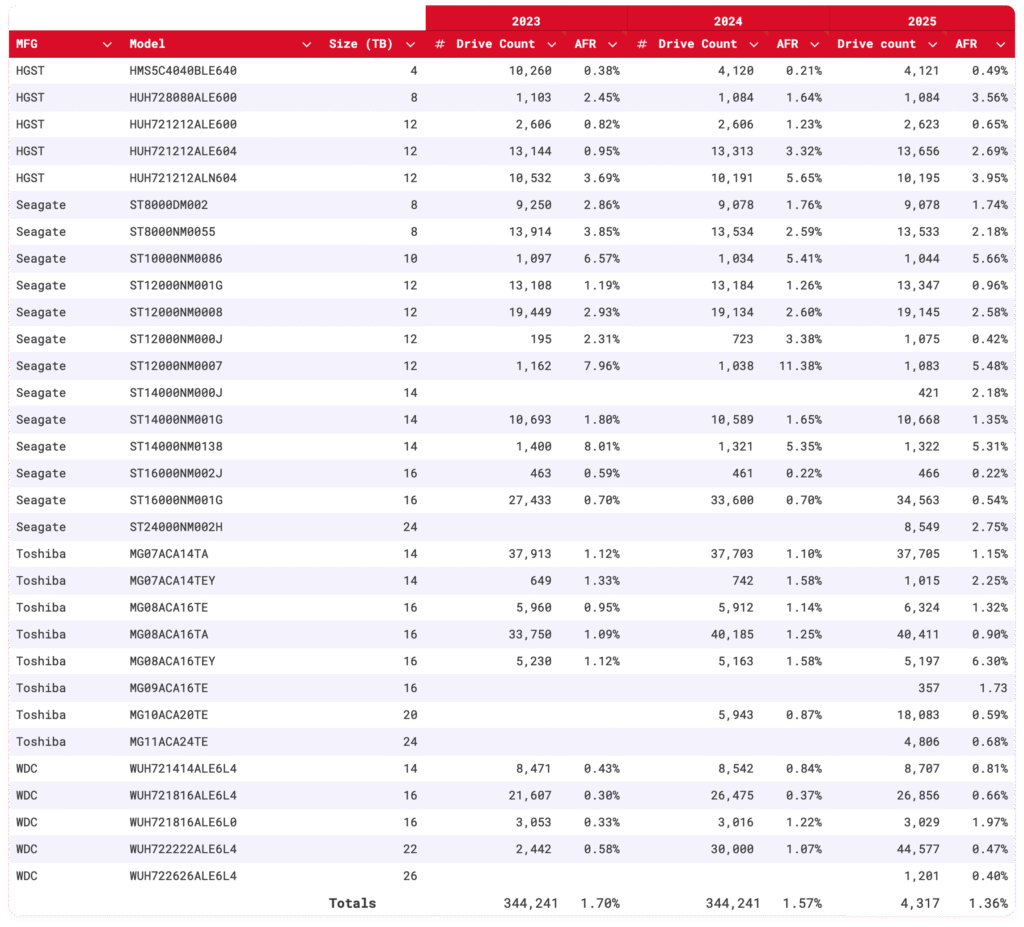
Notes and observations
- The annual AFR is down to 1.36%. We haven’t seen those numbers since 2022 (1.37%). Cool!
- Slicing our data by drive size shows how impactful the shift to high capacity drives really is: based on the current quarterly data, our drive size breakdown looks like this:
- 0–12TB: 25.13%
- 14–16TB: 52.06%
- 20TB+: 22.81%
This is an already long report, so in the interest of time, we’ll just say this: There are multiple factors that go into how and why things are changing, including the average age of drives within our cohort, how much drive technology has improved over the years, how drives on the market have gotten bigger over time while the cost per GB has also dropped, and how the current demand for drives has been changing some of those things.
If that sentence sounds confusing, welcome to the world of enterprise drive buying. But, as always, we have to contextualize the real data we see with the way we source and use drives.
Lifetime hard drive failure rates
Backblaze Lifetime Hard Drive Failure Rates
Reporting period ending December 31, 2025 inclusive
Drive models with > 500 drives and > 100,000 lifetime drive days
Notes and observations
- Ol’ faithful: Lifetime AFR is 1.30% this quarter, and there’s been no significant change in that number for quite some time.
- Say hi to the new guy: The Toshiba MG11ACA24TE 24TB made the cut for the lifetime table. Last quarter, we deployed another 2,400 of these, bringing us to 4,806 drives total.
The Hard Drive dataset (and beyond)
Thank you, as always, for making it through ~2,500 or so words to examine the fun side of data. Here’s our standard fine print:
The complete dataset used to create the tables and charts in this report is available on our Hard Drive Test Data page. You can download and use this data for free for your own purpose. All we ask are three things:
- You cite Backblaze as the source if you use the data;
- You accept that you are solely responsible for how you use the data, and;
- You do not sell this data itself to anyone; it is free.
If you’re a new Drive Stats fan, consider signing up for the newsletter. If you’re not ready for that kind of commitment, sound off in the comments section below or reach out directly to us to let us know what you’re working on. Happy investigating!