When we first published our Drive Stats data back in February 2015, we did it because it seemed like the Backblaze thing to do. We had previously open-sourced our Storage Pod designs, so publishing the Drive Stats data made sense for two reasons. The first was transparency. We were publishing our Drive Stats reports based on that data and we wanted people to trust the accuracy of those reports.
The second reason was that it gave people, many of whom are much more clever than us, the ability to play with the data, and that’s what they did. Over the years, the Drive Stats data has been used in projects ranging from training sets for college engineering and statistics students to being a source for scientific and academic papers and articles. In fact, using Google Scholar, you will find 105 papers and articles since 2018 where the Drive Stats data was cited as a source.
One of those papers is “Interpretable predictive maintenance for hard drives” by Maxime Amram et al., which describes methodology for predicting hard drive failure using various machine learning techniques. At the center of the research team’s analysis is the Drive Stats data, but before we dive into that paper, let’s take a minute or two to understand the data itself.
The Hard Drive Stats Data
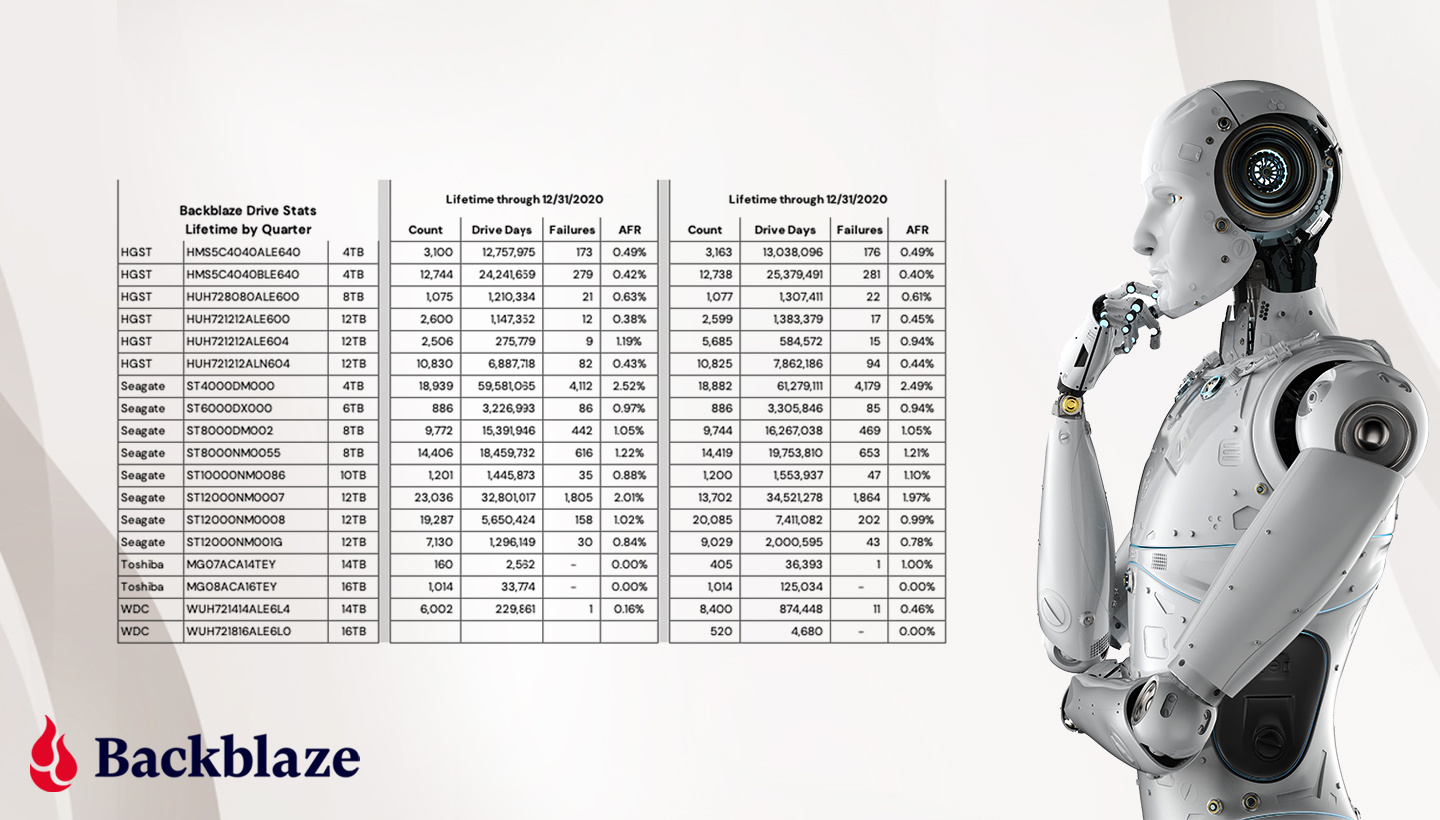
Each day, we collect operational data from all of the drives in our data centers worldwide. There is one record per drive per day. As of September 30, 2021, there were over 191,000 drives reporting each day. In total, there are over 266 million records going back to April 2013, and each data record consists of basic drive information (model, serial number, etc.) and any SMART attributes reported by a given drive. There are 255 pairs of SMART attributes possible for each drive model, but only 20 to 40 are reported by any given drive model.
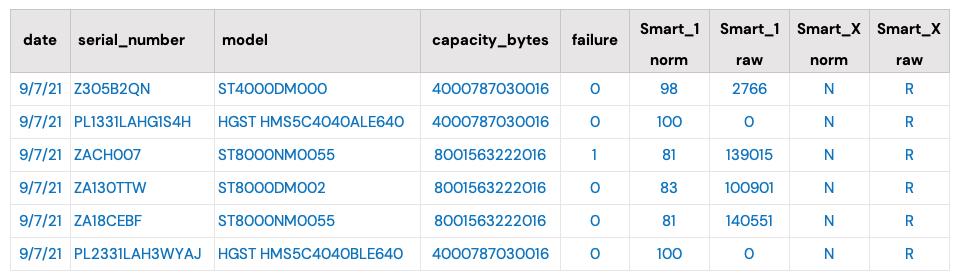
The data reported comes from each drive itself and the only fields we’ve added manually are the date and the “failure” status: zero for operational and one if the drive has failed and been removed from service.
Predicting Drive Failure
Using the SMART data to predict drive failure is not new. Drive manufacturers have been trying to use various drive-reported statistics to identify pending failure since the early 1990s. The challenge is multifold, as you need to be able to:
- Determine a SMART attribute or group of attributes which predict failure is imminent in a given drive model.
- Keep the false positive rate to a minimum.
- Be able to test the hypothesis on a large enough data set with both failed and operational drives.
Even if you can find a combination of SMART attributes which fit the bill, you are faced with two other realities:
- By the time you determine and test your hypothesis, is the drive model being tested still being manufactured?
- Is the prediction really useful? For example, what is the value of an attribute that is 95% accurate at predicting failure, but only occurs in 1% of all failures.
Machine Learning and Drive Failure
Before we start, we highly encourage you to read the paper, “Interpretable predictive maintenance for hard drives,” noted earlier. This will provide you with the context for what we will cover here.
The paper sets out to examine whether the application of algorithms for interpretable machine learning would provide meaningful insights about short-term and long-term drive health and accurately predict drive failure in the process.
Analysis of Backblaze and Google Methodologies
Backblaze (Beach/2014 and Klein/2016) and Google (Pinheiro et al./2007) analyzed SMART data they collected to determine drive failure in a population of hard drives. Each identified similar SMART attributes which correlated to some degree to drive failure:
- 5 (Reallocated Sectors Count).
- 187 (Reported Uncorrectable Errors).
- 188 (Command Timeout)—Backblaze only.
- 197 (Current Pending Sectors Count).
- 198 (Offline Uncorrectable Sectors Count).
Given that both were univariate analyses i.e., only considering correlation between drive failure and a single metric at a time, the results, while useful, left open the opportunity for validation using more advanced methods. That’s where machine learning comes in.
Predicting Long-term Drive Health
For their analysis in the paper, Interpretable AI focused on the Seagate 12TB drive, model: ST12000NM0007, for the period ending Q1 2020, and analyzed daily records of over 35,000 drives.
An overview of the methodology used by Interpretable AI to predict long-term drive health is as follows:
- Compute the remaining useful life of each drive until failure for each drive, each day.
- Use that data combined with the daily SMART data to train an Optimal Survival Tree that models how the remaining life of each drive is affected by the SMART values.
Each SMART attribute is represented by one node in the Optimal Survival Tree. Each node splits in two leaf nodes as determined by the analysis. Hard drives are recursively routed down the tree based on their SMART values, with the node value and hierarchy adjusting for each drive that passes through. The model learns the best values for each node as more drives pass through until all the drives are divided into collections which best represent their collective data. Below is the Optimal Decision Tree for predicting long-term health (“Interpretable predictive maintenance for hard drives,” Figure 3).
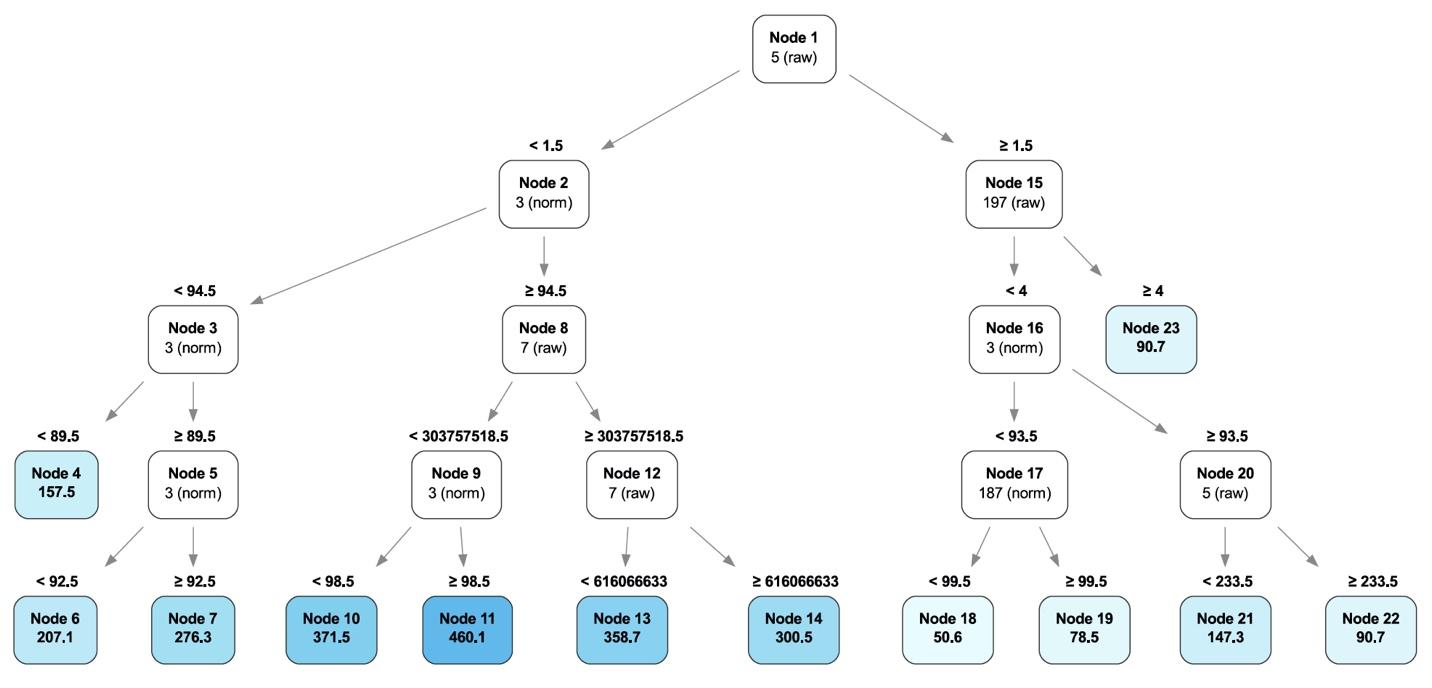
At the top of the tree is SMART 5 (raw value), which is deemed the most important SMART value to determine drive failure in this case, but it is not alone. Traveling down the branches of the tree, other SMART attributes become part of a given branch, adding or subtracting their value towards predicting drive health along the way. The analysis leads to some interesting results that univariate analysis cannot see:
- Poor Drive Health: The path to Node 11 is the set of conditions (SMART attribute values) that if present, predicts the failure of the drive within 50 days.
- Healthy Drives: The path to Node 18 is the set of conditions (SMART attribute values) that predicts that at least half of the drives that meet those conditions will not fail within two years.
Predicting Short-term Drive Health
The same methodology used on predicting long-term drive health is used for predicting short-term drive health as well. The difference is that for the short-term use case, only data for a 90-day period is used. In this case, this is the data from Q1 2020 for the same Seagate drives analyzed in the previous section. The goal is to determine the ability to predict hard drives failures 30, 60, and 90 days out.
The paper also discussed a second methodology which treats the analysis as a classification problem that occurs in a specific time window. The results are similar to the Optimal Survival Tree methodology for the period and as such, that methodology is not discussed here. Please refer to the paper for additional details.
Applying the Optimal Survival Tree methodology to the Q1 2020 data, we find that while SMART 5 is still the primary factor, the contribution of other SMART attributes has changed versus the long-term health process. For example, SMART 187 is more important, while SMART 197 has diminished in value so much that it is not considered important in assessing the short-term health of the drives. Below is the Optimal Decision Tree for predicting short-term health (“Interpretable predictive maintenance for hard drives,” Figure 6).
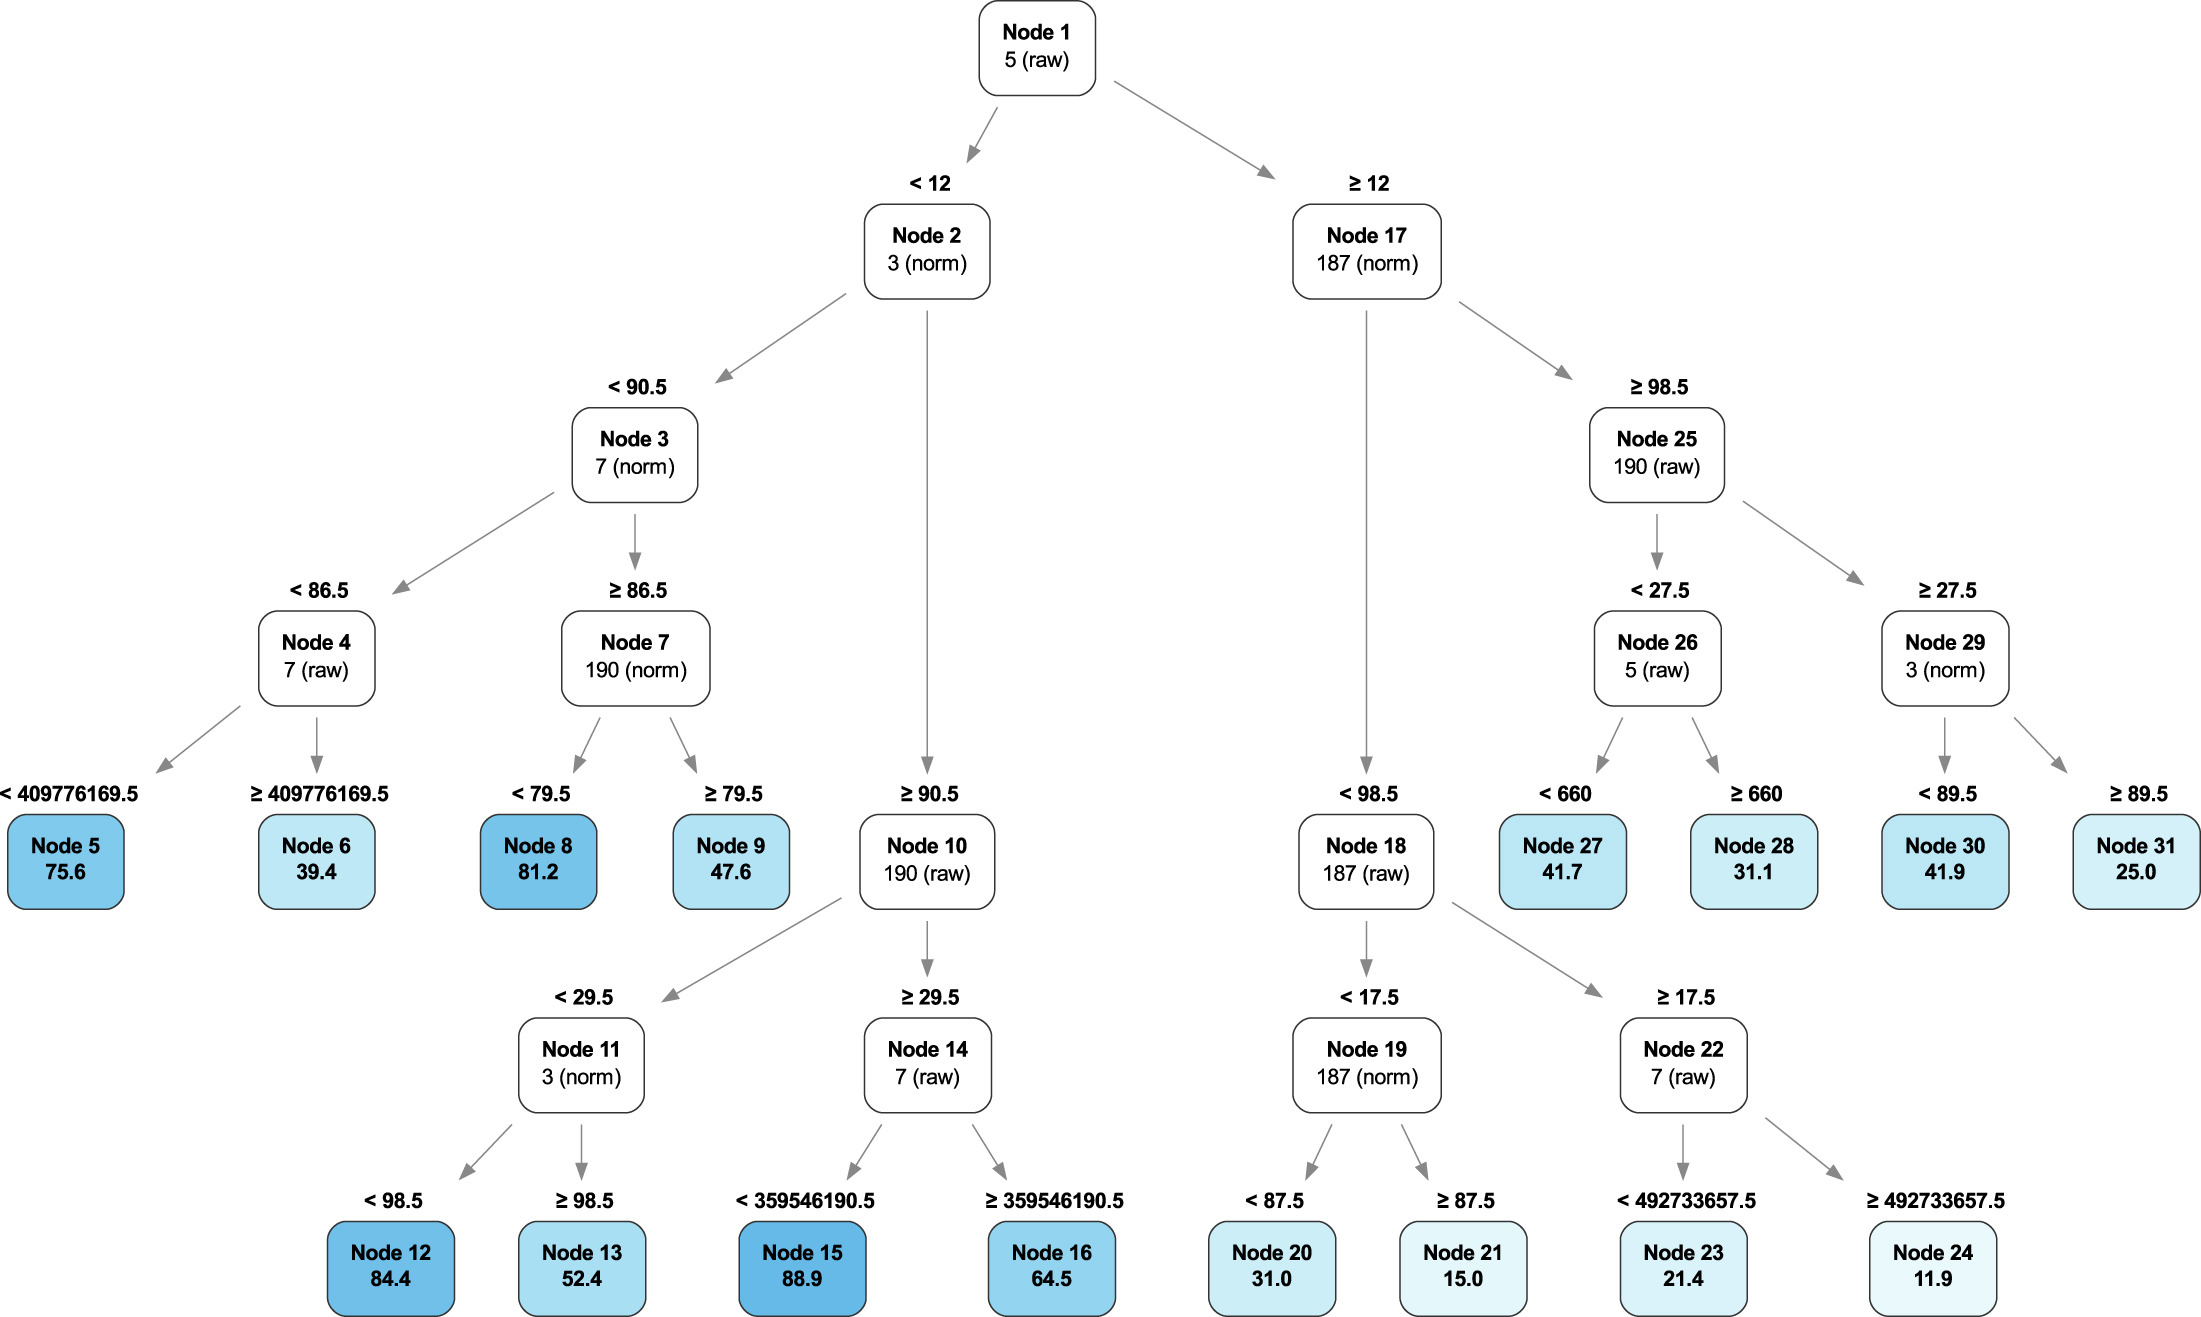
Traveling down the branches of the tree, we can once again see some interesting results that univariate analysis cannot see:
- Poor Drive Health: Nodes 21 and 24 identify a set of conditions (SMART attribute values) that, if present, predict almost certain failure within 90 days.
- Healthy Drives: Nodes 12 and 15 identify a set of conditions (SMART attribute values) that, if present, identify healthy drives with little chance of failure within 90 days.
How Much Data Do You Need?
One of the challenges we noted earlier with predicting drive failure was the amount of data needed to achieve the results. In predicting the long-term health of the drives, the Interpretable AI researchers first used three years of drive data. Once they determined their results, they reduced the data used to one year, 557,936 observations, and then randomly resampled 50,000 observations from that initial data set to train their model with the remainder used for testing.
The resulting Optimized Survival Tree was similar to that of the long-term health survival tree in that they were still able to identify nodes where accelerated failure was evident.
Learn More
To learn more about how Optimized Survival Trees were applied to predict hard drive failure, join one of authors, Daisy Zhuo, PhD, co-founding partner of Interpretable AI, as she discusses the findings with Andy Klein of Backblaze. Join us, live, on Thursday, October 14, at 10 a.m. Pacific, or streaming any time afterwards. Sign up today.
Final Thoughts
There have been many other papers attempting to apply machine learning techniques to predicting hard drive failure. The Interpretable paper was the focus of this post as I found their paper to be approachable and transparent, two traits I admire in writing. Those two traits are also defining characteristics of the word, “interpretable,” so there’s that. As for the other papers, a majority are able to predict drive failure at various levels of accuracy and confidence using a wide variety of techniques.
Hopefully it is obvious that predicting drive failure is possible, but will never be perfect. We at Backblaze don’t need it to be. If a drive fails in our environment, there are a multitude of backup strategies in place. We manage failure every day, but tools like those described in the Interpretable paper make our lives a little easier. On the flip side, if you trust your digital life to one hard drive or SSD, forget about predicting drive failure—assume it will happen today and back up your data somewhere, somehow before it does.
References
“Interpretable predictive maintenance for hard drives,” Maxime Amram et al., ©2021 Interpretable AI LLC. This is an open access article under the CC-BY-NC-ND license. (http://creativecommons.org/licenses/by-nc-nd/4.0/).