How much does operating temperature affect the failure rates of disk drives? Not much.
The unlimited online backup service provided by Backblaze requires a lot of storage. In fact, we recently passed the 100PB mark in our data center. This means we use disk drives. A lot of disk drives.
The Backblaze Storage Pod is designed to provide good air flow over the disk drives, so they don’t get too hot. Still, different locations inside a Pod, and different locations within a data center will have different temperatures, and we wondered whether that was a problem for the drives.
What Other People Say
Google and Microsoft have both done studies on disk drive temperature in their data centers. Google found that temperature was not a good predictor of failure, while Microsoft and the University of Virginia found that there was a significant correlation.
Disk drive manufacturers tell Backblaze that in general, it’s a good idea to keep disks cooler so they will last longer.
All Drives: No Correlation
After looking at data on over 34,000 drives, I found that overall there is no correlation between temperature and failure rate.
To check correlations, I used the point-biserial correlation coefficient on drive average temperatures and whether drives failed or not. The result ranges from -1 to 1, with 0 being no correlation, and 1 meaning hot drives always fail.
Correlation of Temperature and Failure: 0.0
Disk Drive Temperature Range
It turns out that different drive models run at different temperatures, and this can throw off the stats when looking at the entire population. If in a given ambient air temperature, drive model A runs warmer than drive B, and drive A fails more, that will make it look like there is a correlation when there isn’t.
This table shows the average temperature, in degrees Celsius, of different drive models:
| Model | Avg. Temp (C) | |
|---|---|---|
| Seagate Barracuda LP | (ST31500541AS) | 21.92 |
| Seagate Desktop HDD.15 | (ST4000DM000) | 22.10 |
| Seagate Barracuda Green | (ST1500DL003) | 22.86 |
| Western Digital Red | (WDC WD30EFRX) | 23.05 |
| Seagate Barracuda LP | (ST32000542AS) | 23.27 |
| Western Digital Caviar Green | (WDC WD30EZRX) | 23.46 |
| Seagate Barracuda 7200.14 | (ST3000DM001) | 24.71 |
| Western Digital Caviar Green | (WDC WD10EACS) | 25.23 |
| Seagate Barracuda XT | (ST33000651AS) | 25.40 |
| Hitachi Deskstar 5K4000 | (Hitachi HDS5C4040ALE630) | 25.42 |
| Seagate Barracuda 7200.11 | (ST31500341AS) | 25.73 |
| Toshiba DT01ACA Series | (TOSHIBA DT01ACA300) | 25.82 |
| Hitachi Deskstar 5K3000 | (Hitachi HDS5C3030ALA630) | 26.46 |
| Hitachi Deskstar 7K3000 | (Hitachi HDS723030ALA640) | 26.75 |
| HGST Deskstar 7K4000 | (HGST HDS724040ALE640) | 27.22 |
| Hitachi Deskstar 7K2000 | (Hitachi HDS722020ALA330) | 27.39 |
| HGST Megascale 4000 | (HGST HMS5C4040ALE640) | 27.84 |
| Western Digital Caviar Green | (WDC WD10EADS) | 27.93 |
| Seagate Barracuda XT | (ST4000DX000) | 30.54 |
Each Storage Pod in our data center is initially deployed with one model of drive in all 45 slots. It tends to stay that way over time, too, as drives are replaced. Pods with different models of drives are distributed somewhat randomly around the data center, so on the average, each model runs in an environment that is about the same. The temperatures in the table above are due to differences in the disk drives more than differences in their environment.
The first five drives in the above list are all advertised as “green,” low-power drives. It makes sense that they run cooler because they generate less heat.
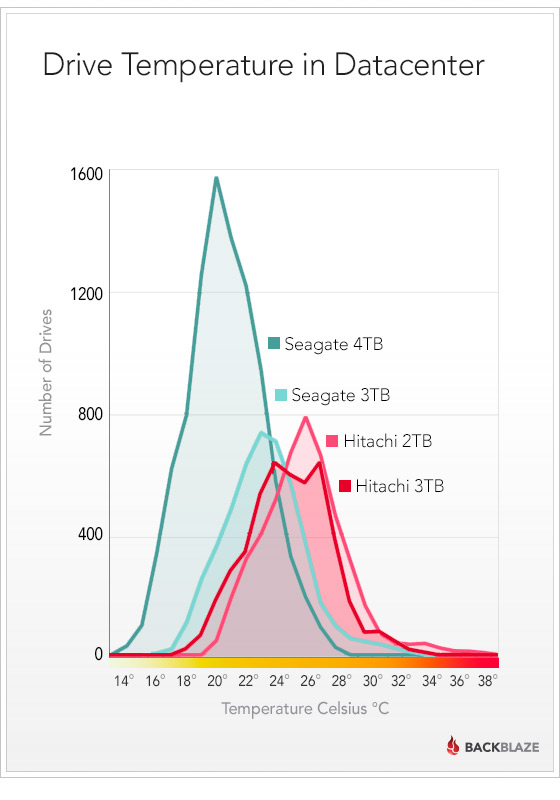
The chart below shows the distribution of drive temperatures for our four most popular drives. As you can see, all of the drives are well within the 0° (or 5°) to 60° that the manufacturers specify for the drives. And almost all of the drives are in the nice comfortable range from 15° to 30°.
Correlations Between Temperature and Failure for Different Drives
Now, let’s look at the correlation between temperatures and failures for each drive model. Here’s the same set of models, this time sorted by correlation. The correlations that are statistically significant are in bold:
| Model | Correlation | Significant? | p-value | # dead | # alive | Avg. Age (years) |
|---|---|---|---|---|---|---|
| Western Digital Caviar Green (WDC WD10EACS) |
0.18 | no | 0.07 | 2 | 107 | 4.9 |
| Seagate Barracuda 7200.11 (ST31500341AS) |
0.17 | YES | 0.00 | 157 | 628 | 3.8 |
| Seagate Barracuda LP (ST31500541AS) |
0.12 | YES | 0.00 | 195 | 1992 | 3.8 |
| Seagate Barracuda Green (ST1500DL003) |
0.05 | no | 0.61 | 66 | 50 | 0.8 |
| Seagate Barracuda 7200.14 (ST3000DM001) |
0.03 | YES | 0.02 | 638 | 4031 | 1.4 |
| Western Digital Red (WDC WD30EFRX) |
0.02 | no | 0.67 | 21 | 661 | 0.5 |
| Western Digital Caviar Green (WDC WD30EZRX) |
0.01 | no | 0.88 | 22 | 477 | 1.7 |
| Hitachi Deskstar 5K4000 (Hitachi HDS5C4040ALE630) |
0.00 | no | 0.82 | 32 | 2671 | 0.8 |
| Seagate Desktop HDD.15 (ST4000DM000) |
-0.01 | no | 0.25 | 133 | 9350 | 0.3 |
| Seagate Barracuda LP (ST32000542AS) |
-0.02 | no | 0.71 | 22 | 363 | 2.0 |
| Hitachi Deskstar 5K3000 (Hitachi HDS5C3030ALA630) |
-0.02 | no | 0.13 | 36 | 4591 | 1.7 |
| Western Digital Caviar Green (WDC WD10EADS) |
-0.04 | no | 0.39 | 21 | 529 | 4.4 |
| Hitachi Deskstar 7K2000 (Hitachi HDS722020ALA330) |
-0.04 | YES | 0.01 | 57 | 4708 | 2.9 |
| Seagate Barracuda XT (ST4000DX000) |
-0.04 | no | 0.56 | 1 | 179 | 0.7 |
| Hitachi Deskstar 7K3000 (Hitachi HDS723030ALA640) |
-0.04 | no | 0.15 | 14 | 1022 | 2.1 |
| Toshiba DT01ACA Series (TOSHIBA DT01ACA300) |
-0.05 | no | 0.73 | 2 | 58 | 0.7 |
| Seagate Barracuda XT (ST33000651AS) |
-0.05 | no | 0.35 | 23 | 286 | 2.0 |
Seagate Barracuda & Barracuda LP 1.5TB Heat Failure
This is the one drive that does show some correlation between temperature and failure rates. The correlations of 0.17 and 0.11 are weak, but they are statistically significant.
It’s interesting that the correlations are similar for the regular 7200 RPM drive and the low power 5900 RPM drive. The average temperature of the low power drives is 21.9, while the average for the regular drives is 25.7.
Comparing the failure rates of drives that are below the average temperature for the model, and those above the average temperature, there is a clear difference for these drives:
| Annual Failure Rate Cool (below avg. temp) |
Annual Failure Rate Warm (above avg. temp) |
|
|---|---|---|
| Barracuda 1.5TB (ST31500541AS) |
7.9% | 11.0% |
| Barracuda LP 1.5TB (ST31500341AS) |
15.6% | 34.6% |
Why is the correlation weak when these numbers look so obvious? It’s because there’s a lot of overlap between the temperatures of the failed drives and the temperatures of the working drives, so you can’t predict for sure which drives will fail, but the low p-value means that there is a meaningful difference in failure rates.
The failure rate of the ST31500541AS does go up at higher temperatures:
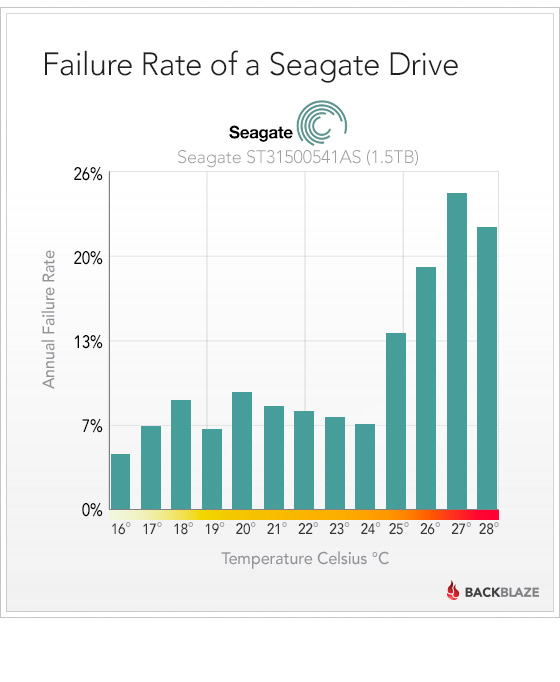
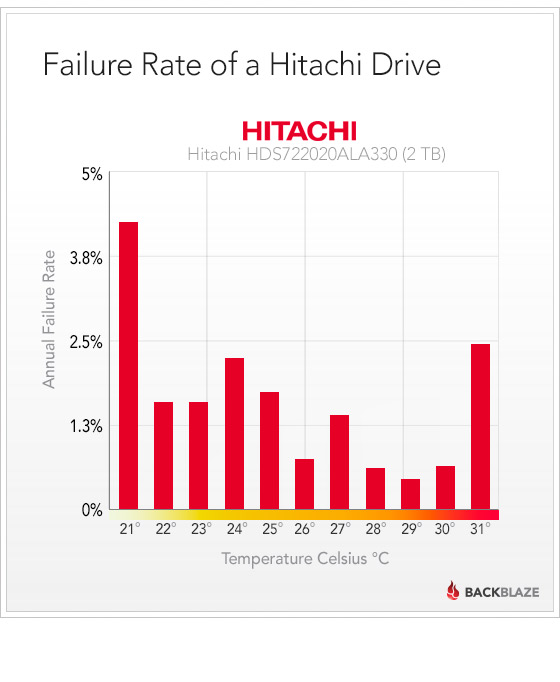
This contrasts with most other drives we have, which don’t show that trend. The Hitachi HDS722020ALA330 is another one of our older drives, and it shows a more typical non-pattern:
Seagate Barracuda 3TB and Hitachi Deskstar 7K2000
These are the remaining two drives that have a statistically significant correlation between temperature and failures, but they show very weak correlations and they are in opposite directions. The Seagate drives fail very slightly more when they are warmer, while the Hitachi drives fail very slightly more when they are cooler. The correlations of 0.03 and -0.04 are weak enough that we shouldn’t draw conclusions from them.
Hard Drive Temperature Takeaways
Overall, there is not a correlation between operating temperature and failure rates. The one exception is the Seagate Barracuda 1.5TB drives, which fail slightly more when they run warmer.
As long as you run drives well within their allowed range of operating temperatures, keeping them cooler doesn’t matter.