I’ve shared a lot of Backblaze data about hard drive failure statistics. While our system handles a drive failing, we prefer to predict drive failures, and use the hard drives’ built-in SMART metrics to help. The dirty industry secret? SMART stats are inconsistent from hard drive to hard drive.
With nearly 40,000 hard drives and over 100,000,000GB of data stored for customers, we have a lot of hard-won experience. See which five of the SMART stats are good predictors of drive failure below. And see the data we have started to analyze from all of the SMART stats to see which other ones predict failure.
S.M.A.R.T.
Every disk drive includes Self-Monitoring, Analysis, and Reporting Technology (SMART), which reports internal information about the drive. Initially, we collected a handful of stats each day, but at the beginning of 2014 we overhauled our disk drive monitoring to capture a daily snapshot of all of the SMART data for each of the 40,000 hard drives we manage. We used Smartmontools to capture the SMART data.
But, before we dig into the data, we first need to define what counts as a failure.
What Is a Failure?
Backblaze counts a drive as failed when it is removed from a Storage Pod and replaced because it has 1) totally stopped working, or 2) because it has shown evidence of failing soon.
A drive is considered to have stopped working when the drive appears physically dead (e.g. won’t power up), doesn’t respond to console commands or the RAID system tells us that the drive can’t be read or written.
To determine if a drive is going to fail soon we use SMART statistics as evidence to remove a drive before it fails catastrophically or impedes the operation of the Storage Pod volume.
From experience, we have found the following five SMART metrics indicate impending disk drive failure:
- SMART 5: Reallocated_Sector_Count.
- SMART 187: Reported_Uncorrectable_Errors.
- SMART 188: Command_Timeout.
- SMART 197: Current_Pending_Sector_Count.
- SMART 198: Offline_Uncorrectable.
We chose these five stats based on our experience and input from others in the industry because they are consistent across manufacturers and they are good predictors of failure.
The Other SMART Stats
We compiled and placed online our list of all the SMART stats across all hard drives we use. For each stat we display the failure rate charts based on the raw and normalized values we recorded. Remember, this is raw data and since different disk drive manufacturers report SMART stats differently, be careful how you use this.
Choosing the Right Stats to Use
There are over 70 SMART statistics available, but we use only five. To give some insight into the analysis we’ve done, we’ll look at three different SMART statistics here. The first one, SMART 187, we already use to decide when to replace a drive, it’s really a test of the analysis. The other two are SMART stats we don’t use right now, but have potentially interesting correlations with failure
SMART 187: Reported_Uncorrect
Backblaze uses this one.
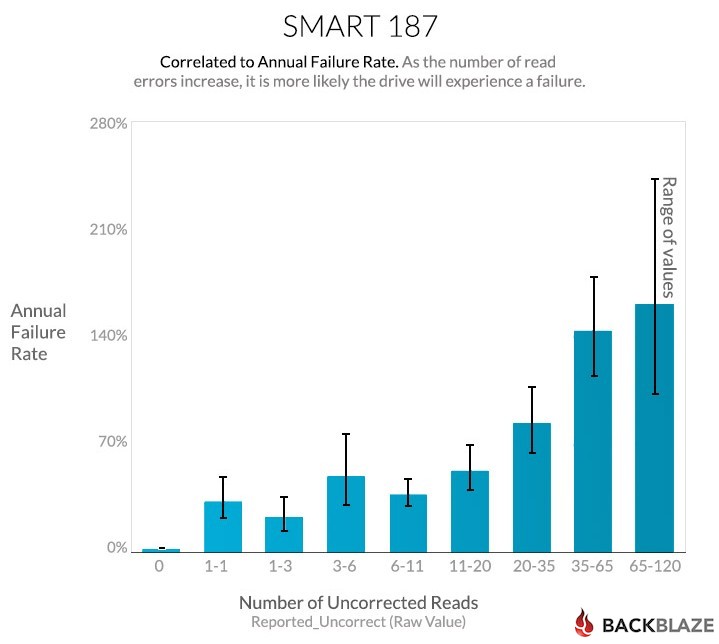
Number 187 reports the number of reads that could not be corrected using hardware ECC. Drives with zero uncorrectable errors hardly ever fail. This is one of the SMART stats we use to determine hard drive failure; once SMART 187 goes above zero, we schedule the drive for replacement.
This first chart shows the failure rates by number of errors. Because this is one of the attributes we use to decide whether a drive has failed, there has to be a strong correlation:
The next question you might ask is: How many drives fall into each of those ranges? That’s answered by the next chart:
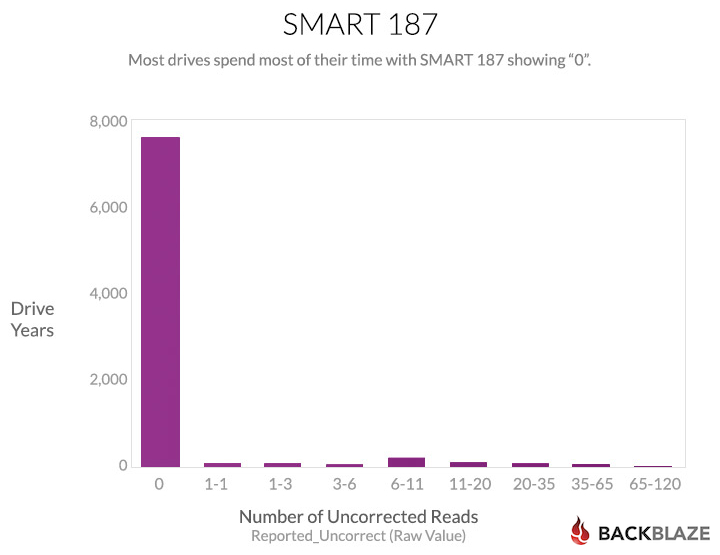
This looks at the full time range of the study, and counts “drive years.” Each day that a drive is in one of the ranges counts as 1/365 of a drive year for that range. Those fractions are all added up to produce the chart above. It shows that most of the daily samples show drives without errors.
For SMART 187, the data appears to be consistently reported by the different manufacturers, the definition is well understood, and the reported results are easy to decipher: zero is good, above zero is bad. For Backblaze this is a very useful SMART stat.
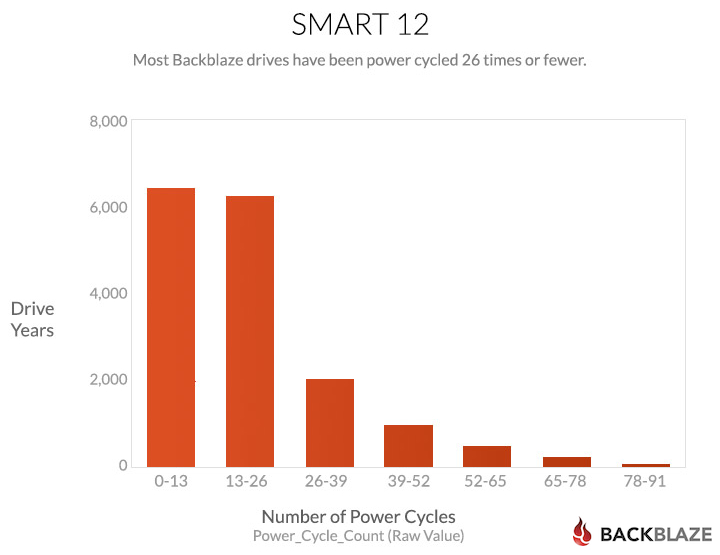
SMART 12: Power_Cycle_Count
Backblaze does not use this one.
The number of times the power was turned off and turned back on correlates with failures:
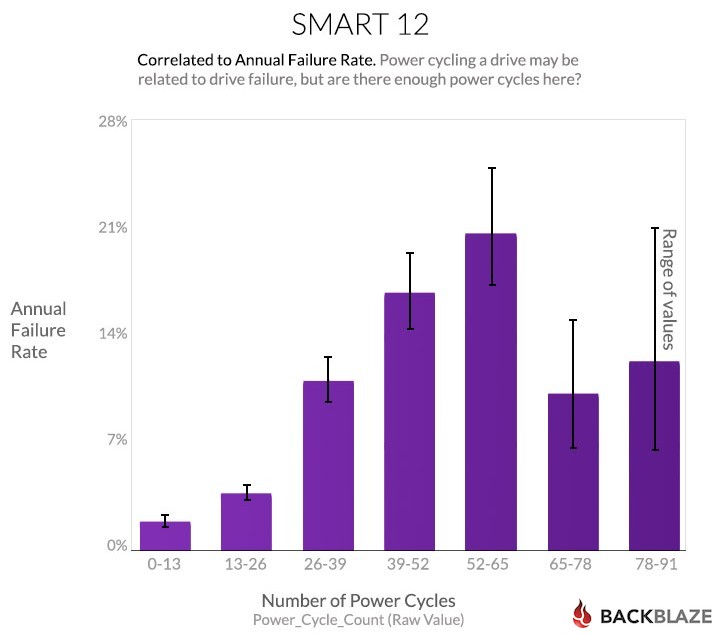
We’re not sure whether this is because cycling the power is bad for the drive, or because working on the Pods is bad for the drives, or because “new” drives have flaws that are exposed during the first few dozen power cycles and then things settle down.
Most of our drives have very few power cycles. They just happily sit in their Storage Pods holding your data. If one of the drives in a Storage Pod fails, we cycle down the entire Storage Pod to replace the failed drive. This only takes a few minutes and then power is reapplied and everything cycles back up. Occasionally we power cycle a Storage Pod for maintenance and on rare occasions we’ve had power failures, but generally, the drives just stay up.
As a result, the correlation of power cycles to failure is strong, but the power cycles may not be the cause of the failures because of our limited number of power cycles for a drive (less than 100) and also considering the variety of other possible failure causes during that period.
In addition to reporting the raw value, drives also report a “normalized” value in the range from 253 (the best) down to one (the worst). The drive is supposed to know what its design criteria and failure modes are, then interpret the raw value and tell you whether it’s good or bad. Unfortunately, with the Power_Cycle_Count, the drives all say the value is 100, which doesn’t lead to a very useful chart.
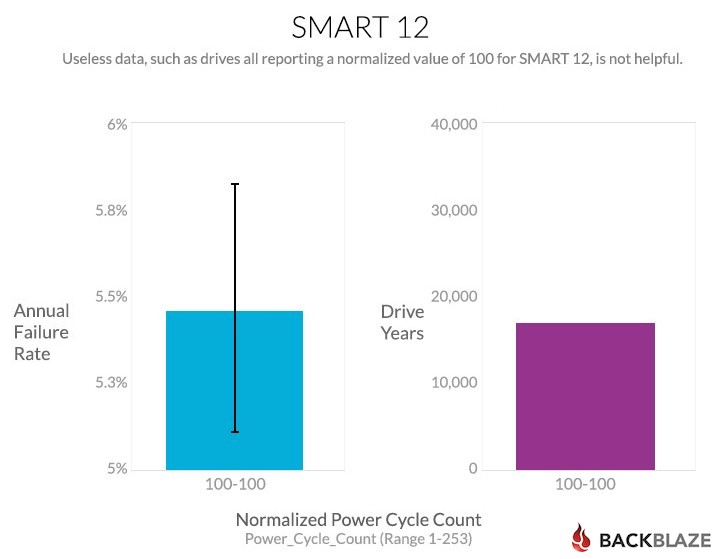
As shown, SMART 12 does not produce a useful normalized value, it doesn’t think that power cycling is a problem at all.
You may ask whether there is a correlation of power cycle count with failures because power cycle count correlates with age, and age correlates with failures. The answer is no. The correlation of power cycle count with age is very weak: 0.05. New drives can have higher power cycle counts, and old drives can have low power cycle counts.
Because Backblaze does not power-cycle our drives very often, this SMART stat is not very useful to us in determining the potential failure of a drive. It also does not answer the age-old question that asks whether turning off your computer every night is better or worse for the disk—that mystery remains.
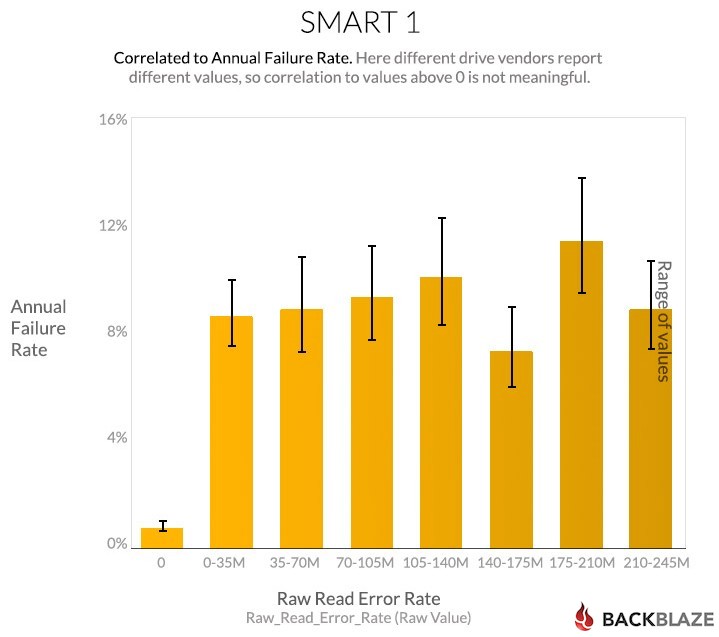
SMART 1: Read_Error_Rate
Backblaze does not use this one.
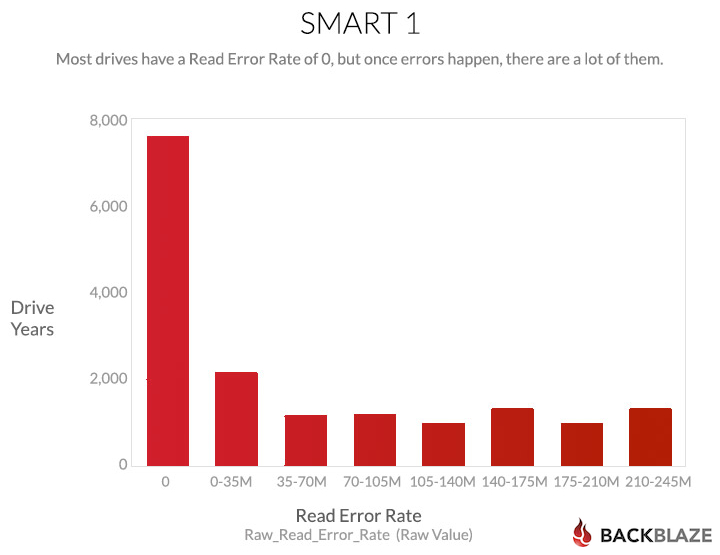
The Wikipedia entry for this one says “The raw value has different structure for different vendors and is often not meaningful as a decimal number.” So the numeric values here probably don’t count anything directly, but it’s clear from the failure rate chart that they have something to do with drives failing, and that non-zero values are worse. Once the value goes above zero, bigger is not worse, though.
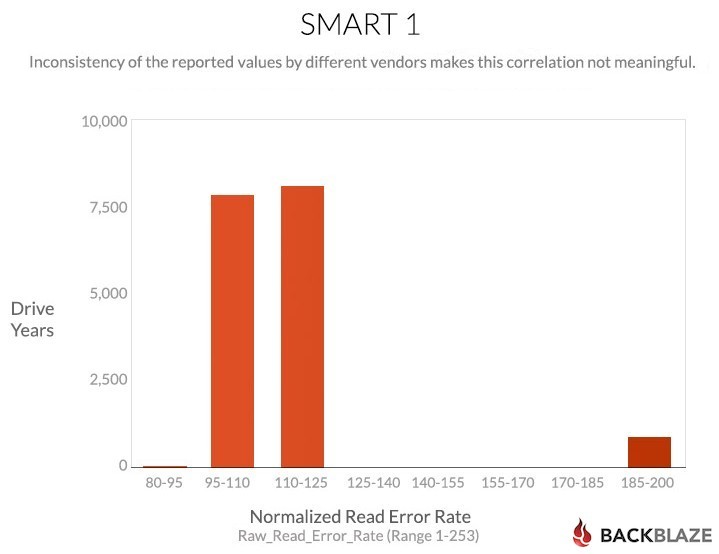
And a lot of the drives have a zero value, presumably meaning “no problem:”
Unlike the Power_Cycle_Count, the scaled value for this the Raw_Read_Error_Rate does what it’s supposed to do: failure rates are higher for lower normalized values, although it’s not a nice smooth progression:
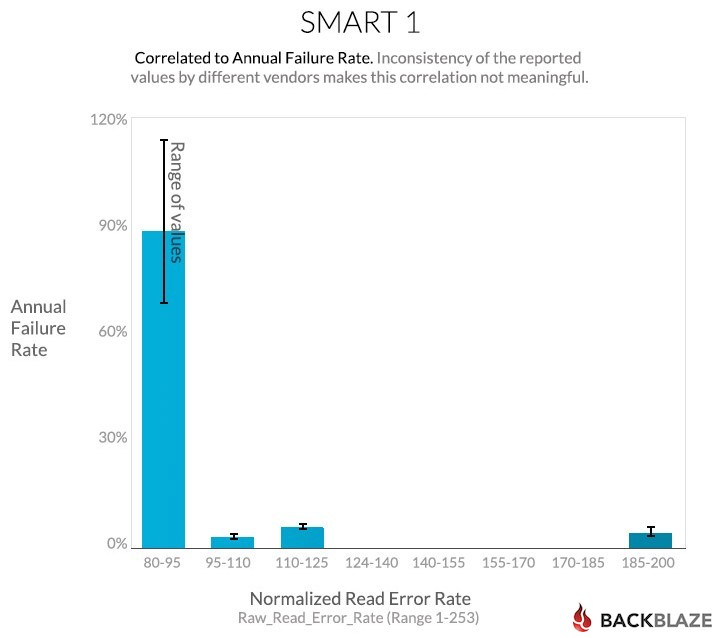
For Backblaze to use this SMART stat we’d like to have a better sense of the values as reported by each vendor. While a value above zero is not good, the inconsistency of the reported values above zero is wildly inconsistent as seen in the charts above using normalized values. Since the manufacturers don’t tell us what their attribute values could be, this SMART stat is not very useful, especially across multiple drive manufacturers.
Tell Us What They Mean
Backblaze uses SMART 5, 187, 188, 197, and 198 for determining the failure or potential failure of a hard drive. We would love to use more—ideally the drive vendors would tell us exactly what the SMART attributes mean. Then we, and the rest of the storage community, could examine the data and figure out what’s going on with the drives.
In the meantime, at Backblaze, we’ll continue gathering data and working to correlate it as best we can. One thing we are looking at is to break down each SMART stat by the drive model, but there are challenges with how drive manufacturers change drive model numbers and how firmware changes occur within a given model. We’ll see if there is anything interesting and let you know.
Remember, you can find charts like the ones above for all of the SMART attributes on our website here. If you see something interesting there and figure out what it means, or know more yourself, be sure to let us know.