The way data moves is changing in the age of AI. As AI training, model tuning, and inferencing accelerate massive, unpredictable flows of data across clouds, our network telemetry here at Backblaze offers a real-world view into the AI data gravity shift: where data lives, how it moves, and what it takes to keep it accessible and affordable.
Over the past couple of years, we’ve shared Network Stats snapshots that shed light on how data moves across Backblaze’s storage cloud. This quarter, we’re taking that foundation further, and evolving this series into a full-fledged transparency report that stands alongside Drive Stats with regular quarterly reporting and stats you can analyze for yourself.
This report isn’t just about traffic patterns. It’s a look at how data movement is changing in the age of AI and what those shifts reveal about performance, cost, and resilience at scale.
Tune in live for The Stats Lab webinar
Drive Stats was the beginning. Want to see the evolution? Check out the Backblaze Stats Lab webinar, bringing together content from all of our Stats articles. We’re going to chat about all things Backblaze and beyond—by the numbers.

In this first report, we’re going to outline the fundamentals of our dataset, highlight standout examples for AI related traffic, and lay the foundation to start sharing our quarter-over-quarter metrics.
Dataset details
Our internal tools allow us to capture network flow data, meaning transmission control protocol (TCP) conversations between parties on our network. Along with basic information such as who is talking and how many bits are being exchanged, we have the ability to record additional pieces of anonymized information like what country, what ISP, or if we’ve seen a particular IP address before. And for each of these metrics, we have numbers for the average, 95th percentile, and maximum values.
Let’s talk about the three elements that make up our dataset: time, values, and metadata.
1. Monthly time slices
For every month, for every region, and for each direction (egress and ingress), we are data warehousing the following metrics. We plan on either using month-by-month numbers, or rolling up into a quarterly value for Network Stats reports going forward.
| Item | Detail |
|---|---|
| Date range | Every month |
| Location scope | Every region (eg US-West, EU-Central) |
| Network traffic direction | Ingress, egress |
2. Metric values
For each monthly snapshot, we’re recording the following details in our data warehouse. Capturing the average, 95th weighted value, and the maximum allows us enough information to profile our traffic.
The 95th value (discarding the highest 5% bursts) gives us a good profile for daily operations and the maximum helps profile burst traffic.
The most interesting metrics that I’m excited to explore are the “bits per IP” values. This combination of “amount of traffic” transferred with “how many actors are involved” per network is a good proxy for what I’m calling the “magnitude” of the network flow. We’re exploring the first insight into this metric below in our chart section.
Defining the Network Stats Quarterly Data
| Item | Field(s) | Detail |
|---|---|---|
| Name | name asn | Common name and BGP ASN of the network |
| Bits | bits_avg bits_95th bits_max | Number of bits/second |
| Packets | packets_avg packets_95th packets_max | Number of packets/second |
| Flows | flow_avg flow_95th flow_max | Number of TCP flows |
| IPs | ip_unique_avg ip_unique_95th ip_unique_max | Number of unique IP addresses |
| Bits per IP | bits_ip_avg bits_ip_95th bits_ip_max | Number of bits per IP address |
| Protocol | v4 v6 | Amount of traffic using IPv4 vs IPv6 |
3. Additional metadata
One of the first custom additions to our dataset is a category field. This helps us define the BGP ASNs (Autonomous System Number), basically the organizations common name associated with a range of IP addresses, that we talk to and group them into categories such as neocloud, hyperscaler, CDN, or general ISP.
Additional Network Stats Metadata
| Item | Field | Detail |
|---|---|---|
| category | group | The class of network carrying the traffic (Cloud, PNI, traditional Internet Transit, or Internal Backblaze-Backblaze) |
| category | type | The type of network receiving the traffic (Neocloud, Hosting/Compute provider, Hyperscaler, CDN, Regional ISP, more localised ISP, etc) |
The global picture
We started capturing this dataset in August of 2025, so we don’t yet have a good amount of data to pull out quarter over quarter trends. But what we can do for now is take a look into some standout metrics for the month of August that we’re interested in tracking over time.
First let’s take a look at where all our traffic goes from a global perspective.
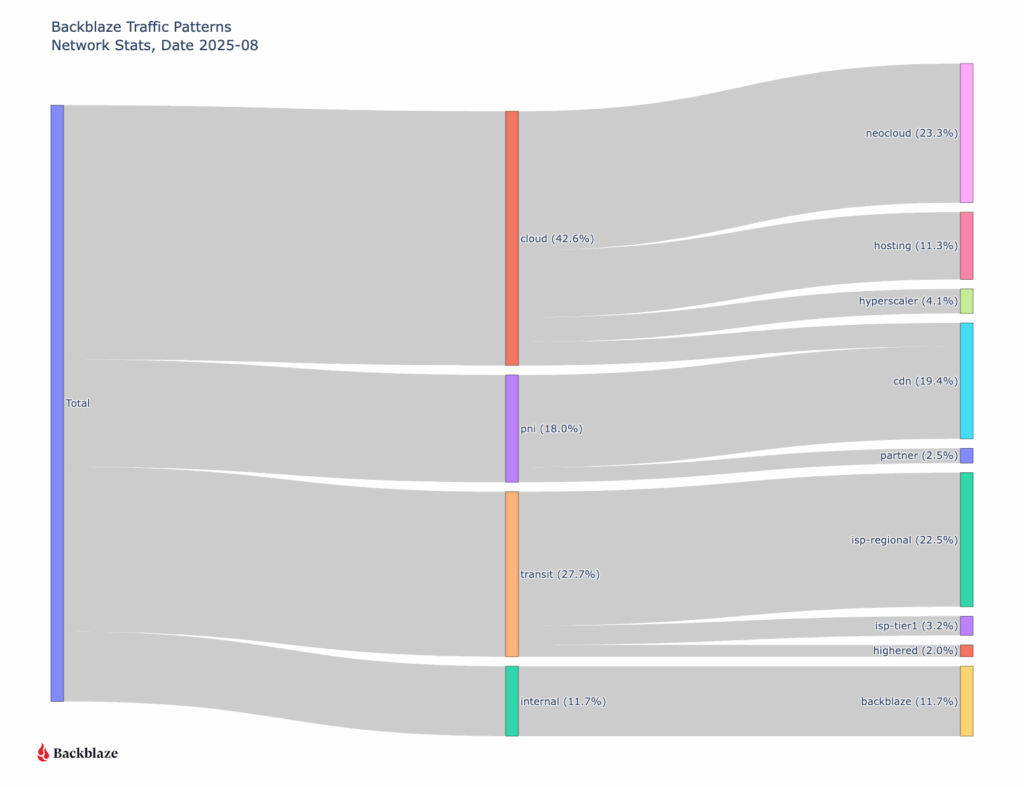
When we look at the data, one pattern stands out immediately: traffic associated with neocloud networks—cloud providers offering compute, GPU, or other AI-related services—already represents nearly a quarter of total ingress and egress across Backblaze’s network. That’s a meaningful signal. Historically CDN traffic has been the majority of our traffic as our B2 Object Storage has been growing. Now, we’re seeing clear evidence of a new class of workload emerging, and it’s AI-shaped.
Neocloud network behavior
Let’s look at the magnitude of our network traffic based on the category of the traffic destination. To help quantify our data set, we interact with around 123,000 unique IP addresses every month.
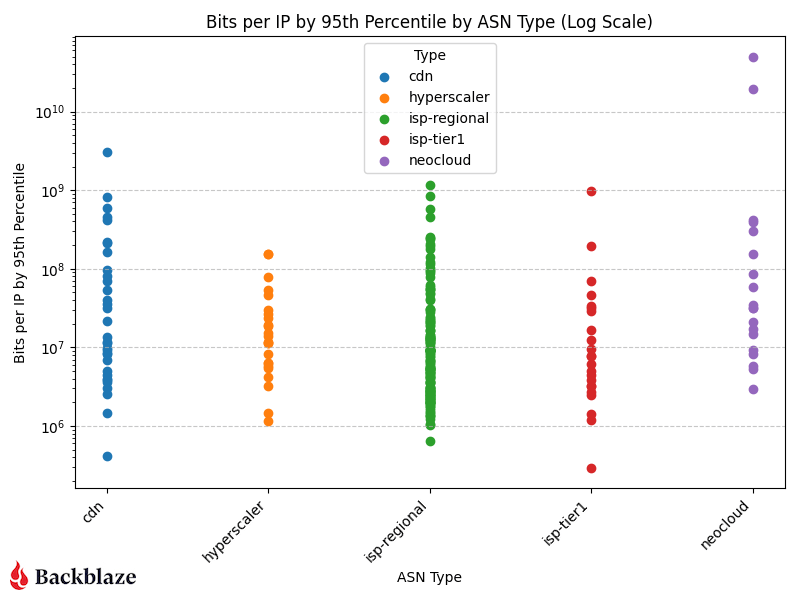
CDN, hyperscaler, isp-regional, and isp-tier one traffic cluster in the same general range of bits per IP, but neoclouds have a couple outliers—the two purple data points in the upper right corner of the log scale graph.
If we change the scale to linear (chart below), now we can see how much of an outlier the AI related traffic is in our sample range.
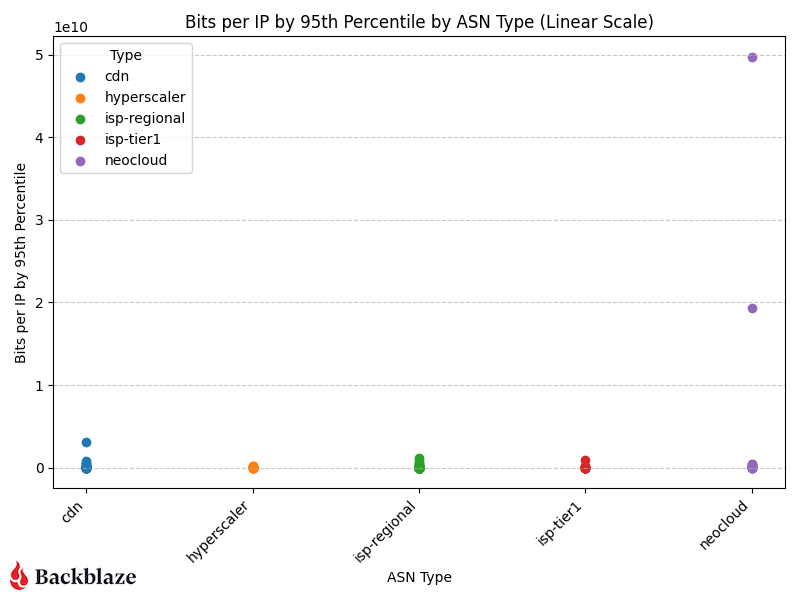
The “magnitude” (as we’re calling it) of the transfers we’re servicing for AI related flows to neoclouds is an order of magnitude greater than all our traffic patterns. This means that there are only a few unique IP addresses that we’re interacting with transferring large amounts of data in their flows.
The rise of AI-driven data movement
Over the past year, AI training and inference have transformed global data flows. Where traditional workloads move steadily, AI workloads move in bursts—rapid retrievals of massive datasets, short high-volume transfers for model training or tuning, and sustained outbound throughput for inferencing pipelines. The magnitude metric we’re introducing (bits per IP address) captures this shift.
As shown in the charts above, AI-related traffic to neoclouds isn’t just heavier, it’s denser. Those purple data points represent a small number of IPs exchanging a disproportionate amount of data. That concentration of flow is a hallmark of AI compute pipelines, where a few high-bandwidth endpoints (often GPU clusters) interact with object storage to repeatedly feed and retrieve training data.
In other words:
- Fewer talkers, bigger flows. AI systems operate in fewer, more intense network sessions than traditional applications.
- Shorter duration, higher peaks. Transfer patterns spike sharply, often corresponding to dataset replication or model checkpointing cycles.
- Cross-cloud mobility. Much of this traffic routes between Backblaze and external compute platforms (classified as neoclouds) showing the rise of multi-cloud AI architectures.
The macro trend: The AI data gravity shift
This pattern reflects a broader macro trend in the cloud ecosystem: AI data gravity is pulling more storage and compute closer together. As AI models grow larger and datasets become more complex, organizations are rethinking where data “lives.” Instead of centralizing everything in one hyperscaler like AWS or Google Cloud Platform, they’re increasingly using cost-efficient, high-throughput storage clouds like Backblaze connected to specialized GPU clouds for compute (case in point: Why CoreWeave’s Object Storage Launch is Good for AI—and Everyone Building It).
This architectural shift explains the outlier traffic patterns we’re seeing on our network. Data isn’t just moving more—it’s moving smarter, following cost, performance, and regional availability cues.
Why it matters
Tracking this kind of data movement and magnitude helps us, and more importantly our customers, understand a few key things:
- Operational readiness for AI workloads: How our network scales under bursty, compute-linked demands. (For more on this check out Making the Backblaze Network AI Ready)
- Cost predictability: Where and when ingress or egress volume spikes may occur.
- Industry evolution: How AI is reshaping the underlying patterns of internet traffic.
What’s next?
This is just the first glimpse of that industry evolution. As our dataset matures, we’ll be able to watch these AI-linked flows change quarter over quarter, offering not just transparency, but a longitudinal view of how the data backbone of the AI economy takes shape.
We’re planning to look at quarter over quarter number tracking for network types, IPv4 traffic vs IPv6 traffic, AI related workflows, cross-cloud connectivity trends, and more. We’re also planning to release the raw data quarterly going forward.
Anything specific you want to see? Let us know in the comments or reach out to our Evangelism team.
We’re excited to share these insights from our network telemetry, the patterns we’re seeing, and what they mean for the broader data economy. This is the stuff we stay up at night studying, and sharing it publicly means we can all better understand the forces shaping digital infrastructure and build with greater confidence and foresight.