In this update, we’ll review the Q2 2017 and lifetime hard drive failure rates for all our current drive models. We also look at how our drive migration strategy is changing the drives we use and we’ll check in on our enterprise class drives to see how they are doing. Along the way we’ll share our observations and insights and as always we welcome your comments and critiques.
Since our last report for Q1 2017, we have added 635 additional hard drives to bring us to the 83,151 drives we’ll focus on. In Q1 we added over 10,000 new drives to the mix, so adding just 635 in Q2 seems odd. In fact, we added 4,921 new drives and retired 4,286 old drives as we migrated from lower density drives to higher density drives. We cover more about migrations later on, but first let’s look at the Q2 quarterly stats.
Hard Drive Stats for Q2 2017
We’ll begin our review by looking at the statistics for the period of April 1, 2017 through June 30, 2017 (Q2 2017). This table includes 17 different 3.5in drive models that were operational during the indicated period, ranging in size from 3TB to 8TB.
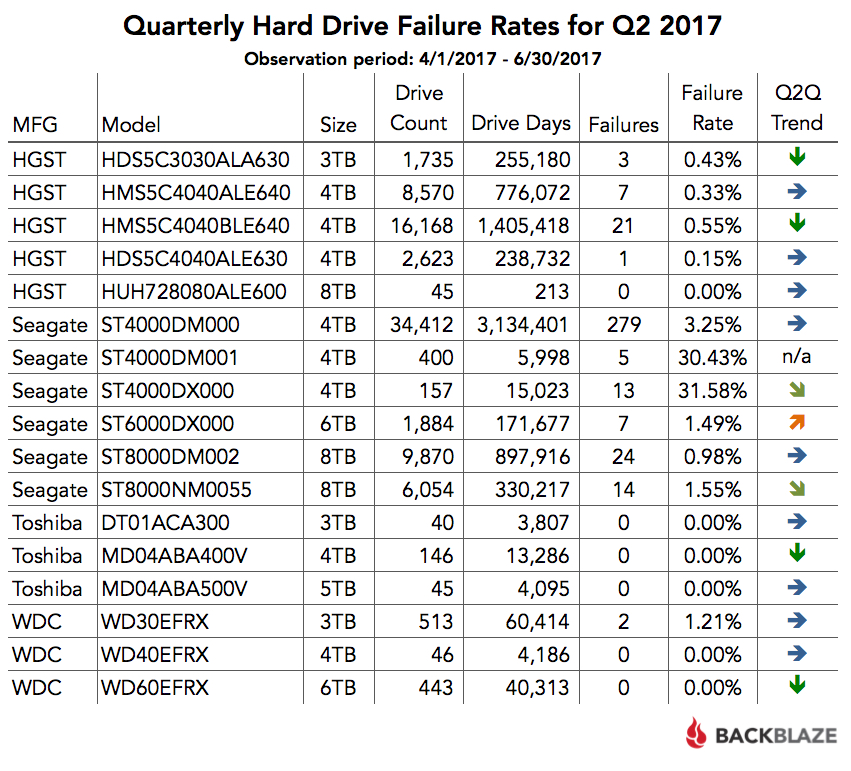
When looking at the quarterly numbers, remember to look for those drives with at least 50,000 drive days for the quarter. That works out to about 550 drives running the entire quarter. That’s a good sample size. If the sample size is below that, the failure rates can be skewed based on a small change in the number of drive failures.
As noted previously, we use the quarterly numbers to look for trends. So this time we’ve included a trend indicator in the table. The “Q2Q Trend” column is short for quarter-to-quarter trend, i.e. last quarter to this quarter. We can add, change, or delete trend columns depending on community interest. Let us know what you think in the comments.
Good Migrations
In Q2 we continued with our data migration program. For us, a drive migration means we intentionally remove a good drive from service and replace it with another drive. Drives that are removed via migrations are not counted as failed. Once they are removed they stop accumulating drive days and other stats in our system.
There are three primary drivers for our migration program.
- Increase storage density: For example, in Q3 we replaced 3TB drives with 8TB drives, more than doubling the amount of storage in a given Storage Pod for the same footprint. The cost of electricity was nominally more with the 8TB drives, but the increase in density more than offset the additional cost. For those interested you can read more about the cost of cloud storage here.
- Backblaze Vaults: Our Vault architecture has proven to be more cost effective over the past two years than using stand-alone Storage Pods. A major goal of the migration program is to have the entire Backblaze Storage Cloud deployed on the highly efficient and resilient Backblaze Vault architecture.
- Balancing the load: With our Phoenix data center online and accepting data, we have migrated some systems to the Phoenix data center. Don’t worry, we didn’t put your data on a truck and drive it to Phoenix. We simply built new systems there and transferred the data from our Northern California data center. In the process, we are gaining valuable insights as we move towards being able to replicate data between the two data centers.
During Q2 we migrated the data on 155 systems, giving nearly 30PB of data a new, more durable, place to call home. There are still 644 individual Storage Pods (“Storage Pod classics,” as we call them) left to migrate to the Backblaze Vault architecture.
Just in case you don’t know, a Backblaze Vault is a logical collection of 20 beefy Storage Pods (not “classics”). Using our own Reed-Solomon erasure coding library, data is spread out across the 20 Pods into 17 data shards and three parity shards. The data and parity shards of each arriving data blob can be stored on different Storage Pods in a given Backblaze Vault.
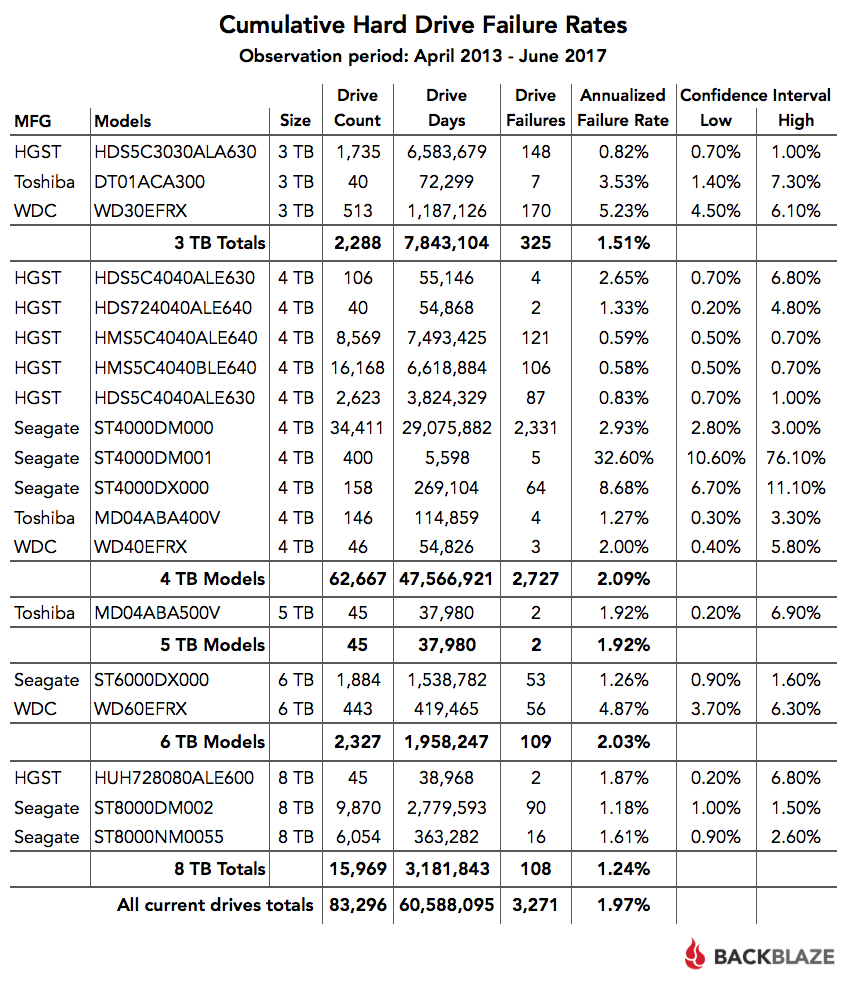
Lifetime Hard Drive Failure Rates for Current Drives
The table below shows the failure rates for the hard drive models we had in service as of June 30, 2017. This is over the period beginning in April 2013 and ending June 30, 2017. If you are interested in the hard drive failure rates for all the hard drives we’ve used over the years, please refer to our 2016 hard drive review.
Enterprise vs. Consumer Drives
We added 3,595 enterprise class 8TB drives in Q2 bringing our total to 6,054 drives. You may be tempted to compare the failure rates of the 8TB enterprise drive (model: ST8000NM005) to the consumer 8TB drive (model: ST8000DM002), and conclude the enterprise drives fail at a higher rate. Let’s not jump to that conclusion yet, as the average operational age of the enterprise drives is only 2.11 months.
There are some insights we can gain from the current data. The enterprise drives have 363,282 drives days and an annualized failure rate of 1.61%. If we look back at our data, we find that as of Q3 2016, the 8TB consumer drives had 422,263 drive days with an annualized failure rate of 1.60%. That means that when both drive models had a similar number of drive days, they had nearly the same annualized failure rate. There are no conclusions to be made here, but the observation is worth considering as we gather data for our comparison.
Next quarter, we should have enough data to compare the 8TB drives, but by then the 8TB drives could be “antiques.” In the next week or so, we’ll be installing 12TB hard drives in a Backblaze Vault. Each 60-drive Storage Pod in the Vault would have 720TB of storage available and a 20-Pod Backblaze Vault would have 14.4 petabytes of raw storage.
Better Late Than Never
Sorry for being a bit late with the hard drive stats report this quarter. We were ready to go last week, then this happened. Some folks here thought that was more important than our Q2 Hard Drive Stats. Go figure.
Drive Stats at the Storage Developers Conference
We will be presenting at the Storage Developers Conference in Santa Clara on Monday, September 11th at 8:30 a.m. We’ll be reviewing our drive stats along with some interesting observations from the SMART stats we also collect. The conference is the leading event for technical discussions and education on the latest storage technologies and standards. Come join us.
The Data for This Review
If you are interested in the data from the two tables in this review, you can download an Excel spreadsheet containing the two tables. Note: the domain for this download will be f001.backblazeb2.com.
You also can download the entire data set we use for these reports from our Hard Drive Test Data page. You can download and use this data for free for your own purposes. All we ask are three things: 1) you cite Backblaze as the source if you use the data, 2) you accept that you are solely responsible for how you use the data, and 3) you do not sell this data to anyone. It is free.
Good luck, and let us know if you find anything interesting.
[Editor’s Note, 29 August 2017: Updated incorrect “drive hours” references to “drive days.” Thanks Marco!]