
A long time ago in a galaxy far, far away, we started collecting and storing Drive Stats data. More precisely it was 10 years ago, and the galaxy was just Northern California, although it has expanded since then (as galaxies are known to do). During the last 10 years, a lot has happened with the where, when, and how of our Drive Stats data, but regardless, the Q1 2023 drive stats data is ready, so let’s get started.
As of the end of Q1 2023, Backblaze was monitoring 241,678 hard drives (HDDs) and solid state drives (SSDs) in our data centers around the world. Of that number, 4,400 are boot drives, with 3,038 SSDs and 1,362 HDDs. The failure rates for the SSDs are analyzed in the SSD Edition: 2022 Drive Stats review.
Today, we’ll focus on the 237,278 data drives under management as we review their quarterly and lifetime failure rates as of the end of Q1 2023. We also dig into the topic of average age of failed hard drives by drive size, model, and more. Along the way, we’ll share our observations and insights on the data presented and, as always, we look forward to you doing the same in the comments section at the end of the post.
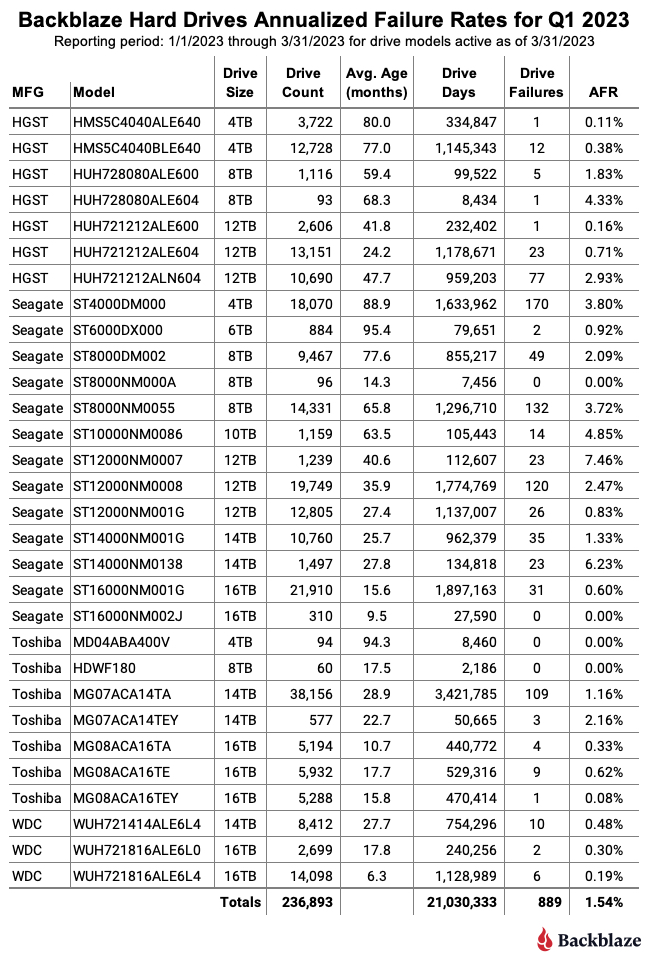
Q1 2023 Hard Drive Failure Rates
Let’s start with reviewing our data for the Q1 2023 period. In that quarter, we tracked 237,278 hard drives used to store customer data. For our evaluation, we removed 385 drives from consideration as they were used for testing purposes or were drive models which did not have at least 60 drives. This leaves us with 236,893 hard drives grouped into 30 different models to analyze.
Notes and Observations on the Q1 2023 Drive Stats
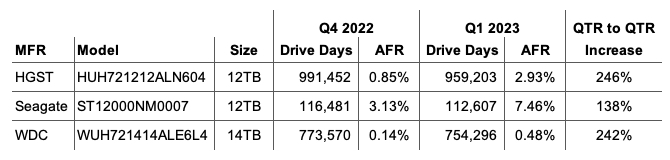
- Upward AFR: The annualized failure rate (AFR) for Q1 2023 was 1.54%, that’s up from Q4 2022 at 1.21% and from one year ago, Q1 2022, at 1.22%. Quarterly AFR numbers can be volatile, but can be useful in identifying a trend which needs further investigation. For example, three drives in Q1 2023 (listed below) more than doubled their individual AFR from Q4 2022 to Q1 2023. As a consequence, further review (or in some cases continued review) of these drives is warranted.
- Zeroes and ones: The table below shows those drive models with either zero or one drive failure in Q1 2023.
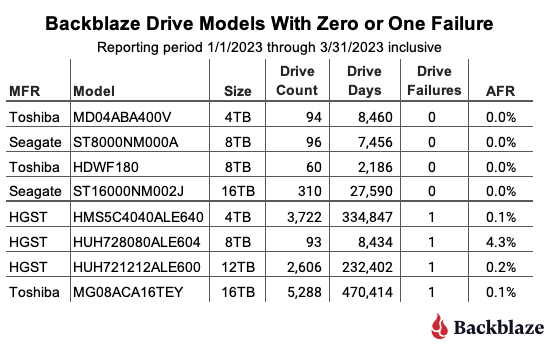
When reviewing the table, any drive model with less than 50,000 drive days for the quarter does not have enough data to be statistically relevant for that period. That said, for two of the drive models listed, posting zero failures is not new. The 16TB Seagate (model: ST16000NM002J) had zero failures last quarter as well, and the 8TB Seagate (model: ST8000NM000A) has had zero failures since it was first installed in Q3 2022, a lifetime AFR of 0%.
- A new, but not so new drive model: There is one new drive model in Q1 2023, the 8TB Toshiba (model: HDWF180). Actually, it is not new, it’s just that we now have 60 drives in production this quarter, so it makes the charts. This model has actually been in production since Q1 2022, starting with 18 drives and adding more drives over time. Why? This drive model is replacing some of the 187 failed 8TB drives this quarter. We have stockpiles of various sized drives we keep on hand for just this reason.
Q1 2023 Annualized Failures Rates by Drive Size and Manufacturer
The charts below summarize the Q1 2023 data first by Drive Size and then by manufacturer.

While we included all of the drive sizes we currently use, both the 6TB and 10TB drive sizes consist of one model for each and each has a limited number of drive days in the quarter: 79,651 for the 6TB drives and 105,443 for the 10TB drives. Each of the remaining drive sizes has at least 2.2 million drive days, making their quarterly annualized failure rates more reliable.
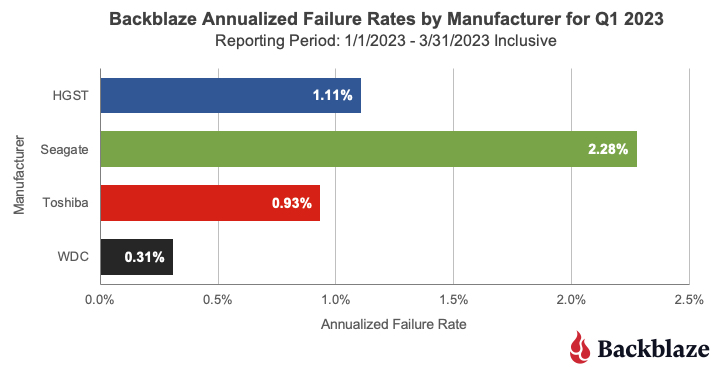
This chart combines all of the manufacturer’s drive models regardless of their age. In our case, many of the older drive models are from Seagate and that helps drive up their overall AFR. For example, 60% of the 4TB drives are from Seagate and are, on average, 89 months old, and over 95% of the 8TB drives in production are from Seagate and they are, on average, over 70 months old. As we’ve seen when we examined hard drive life expectancy using the Bathtub Curve, older drives have a tendency to fail more often.
That said, there are outliers out there like our intrepid fleet of 6TB Seagate drives which have an average age of 95.4 months and have a Q1 2023 AFR of 0.92% and a lifetime AFR of 0.89% as we’ll see later in this report.
The Average Age of Drive Failure
Recently the folks at Blocks & Files published an article outlining the average age of a hard drive when it failed. The article was based on the work of Timothy Burlee at Secure Data Recovery. To summarize, the article found that for the 2,007 failed hard drives analyzed, the average age at which they failed was 1,051 days, or two years and 10 months. We thought this was an interesting way to look at drive failure, and we wanted to know what we would find if we asked the same question of our Drive Stats data. They also determined the current pending sector count for each failed drive, but today we’ll focus on the average age of drive failure.
Getting Started
The article didn’t specify how they collected the amount of time a drive was operational before it failed but we’ll assume they used the SMART 9 raw value for power-on hours. Given that, our first task was to round up all of the failed drives in our dataset and record the power-on hours for each drive. That query produced a list of 18,605 drives which failed between April 10, 2013 and March 30, 2023, inclusive.
For each failed drive we recorded the date, serial_number, model, drive_capacity, failure, and SMART 9 raw value. A sample is below.
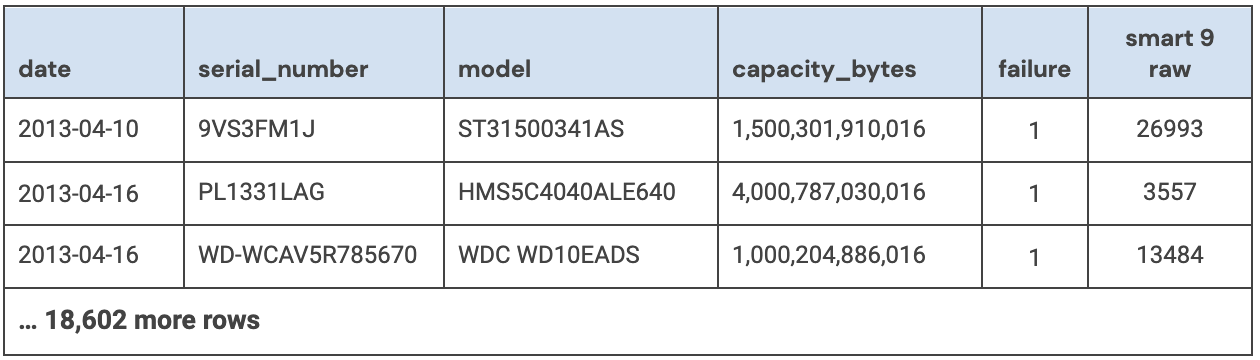
To start the data cleanup process, we first removed 1,355 failed boot drives from the dataset, leaving us with 17,250 data drives.
We then removed 95 drives for one of the following reasons:
- The failed drive had no data recorded or a zero in the SMART 9 raw attribute.
- The failed drive had out of bounds data in one or more fields. For example, the capacity_bytes field was negative or the model was corrupt, that is unknown or unintelligible.
In both of these cases, the drives in question were not in a good state when the data was collected and as such any other data collected could be unreliable.
We are left with 17,155 failed drives to analyze. When we compute the average age at which this cohort of drives failed we get 22,360 hours, which is 932 days, or just over two years and six months. This is reasonably close to the two years and 10 months from the Blocks & Files article, but before we confirm their numbers let’s dig into our results a bit more.
Average Age of Drive Failure by Model and Size
Our Drive Stats dataset contains drive failures for 72 drive models, and that number does not include boot drives. To make our table a bit more manageable we’ve limited the list to those drive models which have recorded 50 or more failures. The resulting list contains 30 models which we’ve sorted by average failure age:
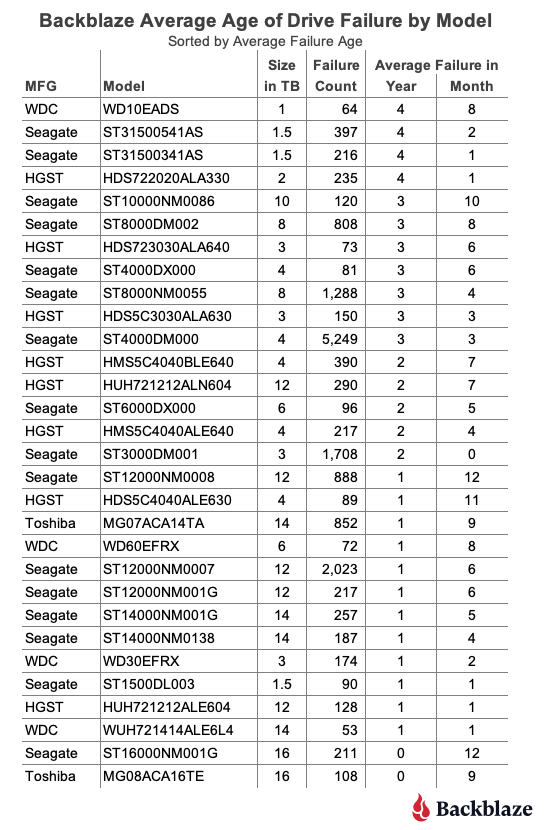
As one would expect, there are drive models above and below our overall failure average age of two years and six months. One observation is that the average failure age of many of the smaller sized drive models (1TB, 1.5TB, 2TB, etc.) is higher than our overall average of two years and six months. Conversely, for many larger sized drive models (12TB, 14TB, etc.) the average failure age was below the average. Before we reach any conclusions, let’s see what happens if we review the average failure age by drive size as shown below.
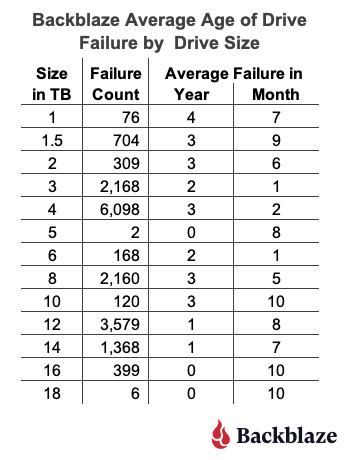
This chart seems to confirm the general trend that the average failure age of smaller drive models is higher than larger drive models.
At this point you might start pondering whether technologies in larger drives such as the additional platters, increased areal density, or even the use of helium would impact the average failure age of these drives. But as the unflappable Admiral Ackbar would say:
“It’s a Trap”
The trap is that the dataset for the smaller sized drive models is, in our case, complete—there are no more 1TB, 1.5TB, 2TB, 3TB, or even 5TB drives in operation in our dataset. On the contrary, most of the larger sized drive models are still in operation and therefore they “haven’t finished failing yet.” In other words, as these larger drives continue to fail over the coming months and years, they could increase or decrease the average failure age of that drive model.
A New Hope
One way to move forward at this point is to limit our computations to only those drive models which are no longer in operation in our data centers. When we do this, we find we have 35 drive models consisting of 3,379 drives that have a failed average age of two years and seven months.
Trap or not, our results are consistent with the Blocks & Files article as their failed average age of two years and 10 months for their dataset. It will be interesting to see how this comparison holds up over time as more drive models in our dataset finish their Backblaze operational life.
The second way to look at drive failure is to view the problem from the life expectancy point of view instead. This approach takes a page from bioscience and utilizes Kaplan-Meier techniques to produce life expectancy (aka survival) curves for different cohorts, in our case hard drive models. We used such curves previously in our Hard Drive Life Expectancy and Bathtub Curve blog posts. This approach allows us to see the failure rate over time and helps answer questions such as, “If I bought a drive today, what are the chances it will survive x years?”
Let’s Recap
We have three different, but similar, values for average failure age of hard drives, and they are as follows:
| Source | Failed Drive Count | Average Failed Age |
|---|---|---|
| Secure Data Recovery | 2,007 failed drives | 2 years, 10 months |
| Backblaze | 17,155 failed drives (all models) | 2 years, 6 months |
| Backblaze | 3,379 failed drives (only drive models no longer in production) | 2 years, 7 months |
When we first saw the Secure Data Recovery average failed age we thought that two years and 10 months was too low. We were surprised by what our data told us, but a little math never hurt anyone. Given we are always adding additional failed drives to our dataset, and retiring drive models along the way, we will continue to track the average failed age of our drive models and report back if we find anything interesting.
Lifetime Hard Drive Failure Rates
As of March 31, 2023, we were tracking 237,278 hard drives. For our lifetime analysis, we removed 385 drives that were only used for testing purposes or did not have at least 60 drives. This leaves us with 236,893 hard drives grouped into 30 different models to analyze for the lifetime table below.
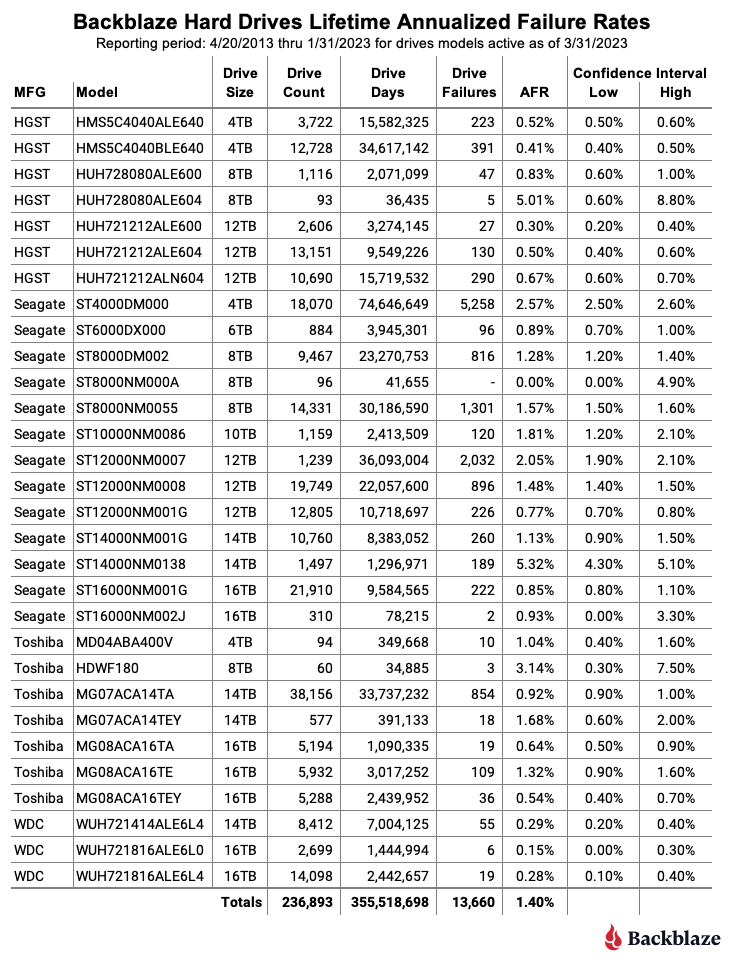
Notes and Observations About the Lifetime Stats
The lifetime AFR for all the drives listed above is 1.40%. That is a slight increase from the previous quarter of 1.39%. The lifetime AFR number for all of our hard drives seems to have settled around 1.40%, although each drive model has its own unique AFR value.
For the past 10 years we’ve been capturing and storing the Drive Stats data which is the source of the lifetime AFRs listed in the table above. But, why keep track of the data at all? Well, besides creating this report each quarter, we use the data internally to help run our business. While there are many other factors which go into the decisions we make, the Drive Stats data helps to surface potential issues sooner, allows us to take better informed drive related actions, and overall adds a layer of confidence in the drive-based decisions we make.
The Hard Drive Stats Data
The complete dataset used to create the information used in this review is available on our Hard Drive Test Data page. You can download and use this data for free for your own purpose. All we ask are three things: 1) you cite Backblaze as the source if you use the data, 2) you accept that you are solely responsible for how you use the data, and 3) you do not sell this data to anyone; it is free.
If you want the tables and charts used in this report, you can download the .zip file from Backblaze B2 Cloud Storage which contains an Excel file with a tab for each table or chart.
Good luck and let us know if you find anything interesting.