As of June 30, 2018 we had 100,254 spinning hard drives in Backblaze’s data centers. Of that number, there were 1,989 boot drives and 98,265 data drives. This review looks at the quarterly and lifetime statistics for the data drive models in operation in our data centers. We’ll also take another look at comparing enterprise and consumer drives, get a first look at our 14 TB Toshiba drives, and introduce you to two new SMART stats. Along the way, we’ll share observations and insights on the data presented and we look forward to you doing the same in the comments.
Hard Drive Reliability Statistics for Q2 2018
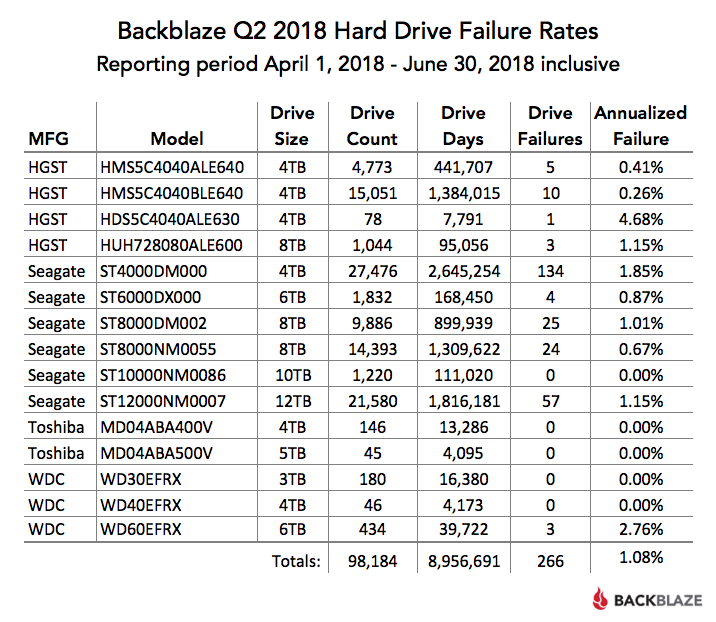
Of the 98,265 hard drives we were monitoring at the end of Q2 2018, we removed from consideration those drives used for testing purposes and those drive models for which we did not have at least 45 drives. This leaves us with 98,184 hard drives. The table below covers just Q2 2018.
Notes and Observations
If a drive model has a failure rate of 0%, it just means that there were no drive failures of that model during Q2 2018.
The Annualized Failure Rate (AFR) for Q2 is just 1.08%, well below the Q1 2018 AFR and is our lowest quarterly AFR yet. That said, quarterly failure rates can be volatile, especially for models that have a small number of drives and/or a small number of Drive Days.
There were 81 drives (98,265 minus 98,184) that were not included in the list above because we did not have at least 45 of a given drive model. We use 45 drives of the same model as the minimum number when we report quarterly, yearly, and lifetime drive statistics. The use of 45 drives is historical in nature as that was the number of drives in our original Storage Pods.
Hard Drive Migrations Continue
The Q2 2018 Quarterly chart above was based on 98,184 hard drives. That was only 138 more hard drives than Q1 2018, which was based on 98,046 drives. Yet, we added nearly 40 PB of cloud storage during Q1. If we tried to store 40 PB on the 138 additional drives we added in Q2 then each new hard drive would have to store nearly 300 TB of data. While 300 TB hard drives would be awesome, the less awesome reality is that we replaced over 4,600 4 TB drives with nearly 4,800 12 TB drives.
The age of the 4 TB drives being replaced was between 3.5 and 4 years. In all cases their failure rates were 3% AFR (Annualized Failure Rate) or less, so why remove them? Simple, drive density — in this case three times the storage in the same cabinet space. Today, four years of service is the about the time where it makes financial sense to replace existing drives versus building out a new facility with new racks, etc. While there are several factors that go into the decision to migrate to higher density drives, keeping hard drives beyond that tipping point means we would be under utilizing valuable data center real estate.
Toshiba 14 TB drives and SMART Stats 23 and 24
In Q2 we added twenty 14 TB Toshiba hard drives (model: MG07ACA14TA) to our mix (not enough to be listed on our charts), but that will change as we have ordered an additional 1,200 drives to be deployed in Q3. These are 9-platter Helium filled drives which use their CMR/PRM (not SMR) recording technology.
In addition to being new drives for us, the Toshiba 14 TB drives also add two new SMART stat pairs: SMART 23 (Helium condition lower) and SMART 24 (Helium condition upper). Both attributes report normal and raw values, with the raw values currently being 0 and the normalized values being 100. As we learn more about these values, we’ll let you know. In the meantime, those of you who utilize our hard drive test data will need to update your data schema and upload scripts to read in the new attributes.
By the way, none of the 20 Toshiba 14 TB drives have failed after 3 weeks in service, but it is way too early to draw any conclusions.
Lifetime Hard Drive Reliability Statistics
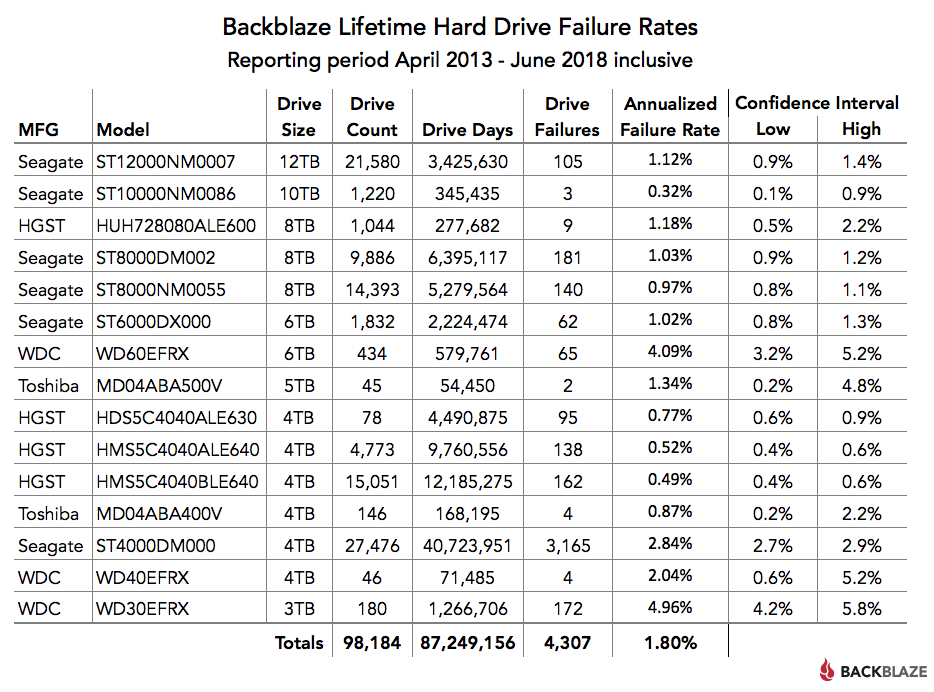
While the quarterly chart presented earlier gets a lot of interest, the real test of any drive model is over time. Below is the lifetime failure rate chart for all the hard drive models in operation as of June 30th, 2018. For each model, we compute its reliability starting from when it was first installed
Notes and Observations
The combined AFR for all of the larger drives (8, 10 and 12 TB) is only 1.02%. Many of these drives were deployed in the last year, so there is some volatility in the data, but we would expect this overall rate to decrease slightly over the next couple of years.
The overall failure rate for all hard drives in service is 1.80%. This is the lowest we have ever achieved, besting the previous low of 1.84% from Q1 2018.
Enterprise versus Consumer Hard Drives
In our Q3 2017 hard drive stats review, we compared two Seagate 8 TB hard drive models: one a consumer class drive (model: ST8000DM002) and the other an enterprise class drive (model: ST8000NM0055). Let’s compare the lifetime annualized failure rates from Q3 2017 and Q2 2018:
Lifetime AFR as of Q3 2017
-
- – 8 TB consumer drives: 1.1% annualized failure rate
- – 8 TB enterprise drives: 1.2% annualized failure rate
Lifetime AFR as of Q2 2018
-
- – 8 TB consumer drives: 1.03% annualized failure rate
- – 8 TB enterprise drives: 0.97% annualized failure rate
Hmmm, it looks like the enterprise drives are “winning.” But before we declare victory, let’s dig into a few details.
- Let’s start with drive days, the total number of days all the hard drives of a given model have been operational.
-
- – 8 TB consumer (model: ST8000DM002): 6,395,117 drive days
- – 8 TB enterprise (model: ST8000NM0055): 5,279,564 drive days
Both models have a sufficient number of drive days and are reasonably close in their total number. No change to our conclusion so far.
-
- Next we’ll look at the confidence intervals for each model to see the range of possibilities within two deviations.
-
- – 8 TB consumer (model: ST8000DM002): Range 0.9% to 1.2%
- – 8 TB enterprise (model: ST8000NM0055): Range 0.8% to 1.1%
The ranges are close, but multiple outcomes are possible. For example, the consumer drive could be as low as 0.9% and the enterprise drive could be as high as 1.1%. This doesn’t help or hurt our conclusion.
-
- Finally we’ll look at drive age — actually average drive age to be precise. This is the average time in operational service, in months, of all the drives of a given model. We’ll will start with the point in time when each drive reached approximately the current number of drives. That way the addition of new drives (not replacements) will have a minimal effect.
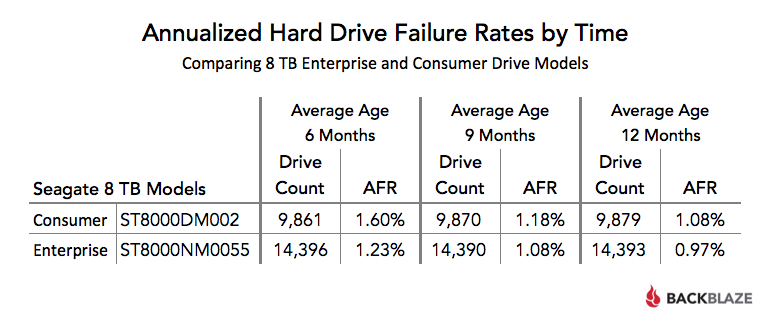 When you constrain for drive count and average age, the AFR (annualized failure rate) of the enterprise drive is consistently below that of the consumer drive for these two drive models — albeit not by much.

Whether every enterprise model is better than every corresponding consumer model is unknown, but below are a few reasons you might choose one class of drive over another:
| Enterprise | Consumer | |
| Longer Warranty: 5 vs. 2 years | Lower price: up to 50% less | |
| More features, i.e. PowerChoice technology | Similar annualized failure rate as enterprise drives | |
| Faster reads and writes | Uses less power |
Backblaze is known to be “thrifty” when purchasing drives. When you purchase 100 drives at a time or are faced with a drive crisis, it makes sense to purchase consumer drives. When you starting purchasing 100 petabytes‘ worth of hard drives at a time, the price gap between enterprise and consumer drives shrinks to the point where the other factors come into play.
Hard Drives By the Numbers
Since April 2013, Backblaze has recorded and saved daily hard drive statistics from the drives in our data centers. Each entry consists of the date, manufacturer, model, serial number, status (operational or failed), and all of the SMART attributes reported by that drive. Currently there are over 100 million entries. The complete data set used to create the information presented in this review is available on our Hard Drive Test Data page. You can download and use this data for free for your own purpose. All we ask are three things: 1) you cite Backblaze as the source if you use the data, 2) you accept that you are solely responsible for how you use the data, and 3) you do not sell this data to anyone. It is free.
If you just want the summarized data used to create the tables and charts in this blog post, you can download the ZIP file containing the MS Excel spreadsheet.
Good luck and let us know if you find anything interesting in the comments below or by contacting us directly.