In Q3 2017, Backblaze introduced both 10 TB and 12 TB hard drives into our data centers, we continued to retire 3 TB and 4 TB hard drives to increase storage density, and we added over 59 petabytes of data storage to bring our total storage capacity to 400 petabytes.
In this update, we’ll review the Q3 2017 and lifetime hard drive failure rates for all our drive models in use at the end of Q3. We’ll also check in on our 8 TB enterprise versus consumer hard drive comparison, and look at the storage density changes in our data centers over the past couple of years. Along the way, we’ll share our observations and insights, and as always, you can download the hard drive statistics data we use to create these reports.
Q3 2017 Hard Drive Failure Rates
Since our Q2 2017 report, we added 9,599 new hard drives and retired 6,221 hard drives, for a net add of 3,378 drives and a total of 86,529. These numbers are for those hard drives of which we have 45 or more drives — with one exception that we’ll get to in a minute.
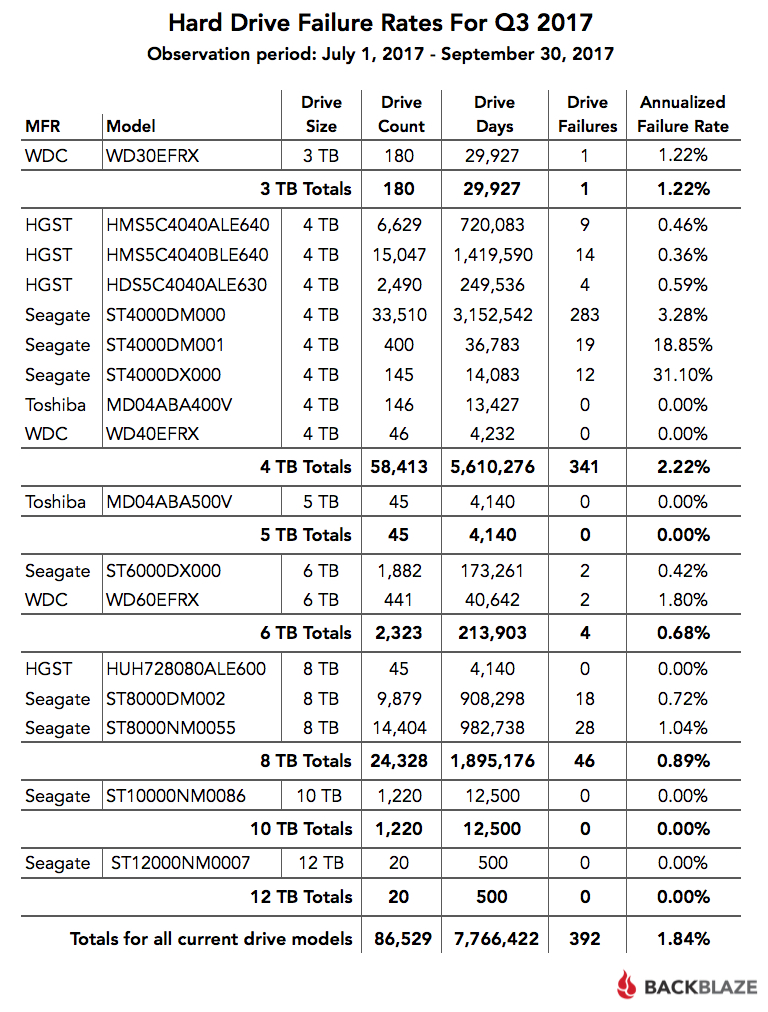
Let’s look at the Q3 statistics that include our first look at the 10 TB and 12 TB hard drives we added in Q3. The chart below is for activity that occurred just in Q3 2017.
Observations
- The hard drive failure rate for the quarter was 1.84%, our lowest quarterly rate ever. There are several factors that contribute to this, but one that stands out is the average age of the hard drives in use. Only the 4 TB HGST drives (model: HDS5C4040ALE630) have an average age over 4 years — 51.3 months to be precise. The average age of all the other drive models is less than 4 years, with nearly 80% of all of the drives being less than 3 years old.
- The 10- and 12 TB drive models are new. With a combined 13,000 drive days in operation, they’ve had zero failures. While all of these drives passed through formatting and load testing without incident, it is a little too early to reach any conclusions.
Testing Drives
Normally, we list only those drive models where we have 45 drives or more, as it formerly took 45 drives (currently 60), to fill a Storage Pod. We consider a Storage Pod as a base unit for drive testing. Yet, we listed the 12 TB drives even though we only have 20 of them in operation. What gives? It’s the first step in testing drives.
A Backblaze Vault consists of 20 Storage Pods logically grouped together. Twenty 12 TB drives are deployed in the same drive position in each of the 20 Storage Pods and grouped together into a storage unit we call a “tome.” An incoming file is stored in one tome, and is spread out across the 20 storage pods in the tome for reliability and availability. The remaining 59 tomes, in this case, use 8 TB drives. This allows us to see the performance and reliability of a 12 TB hard drive model in an operational environment without having to buy 1,200 of them to start.
Breaking news: Our first Backblaze Vault filled with 1,200 Seagate 12 TB hard drives (model: ST12000NM007) went into production on October 20th.
Storage Density Continues to Increase
As noted earlier, we retired 6,221 hard drives in Q3: all 3- or 4 TB hard drives. The retired drives have been replaced by 8-, 10-, and 12 TB drive models. This dramatic increase in storage density added 59 petabytes of storage in Q3. The following chart shows that change since the beginning of 2016.
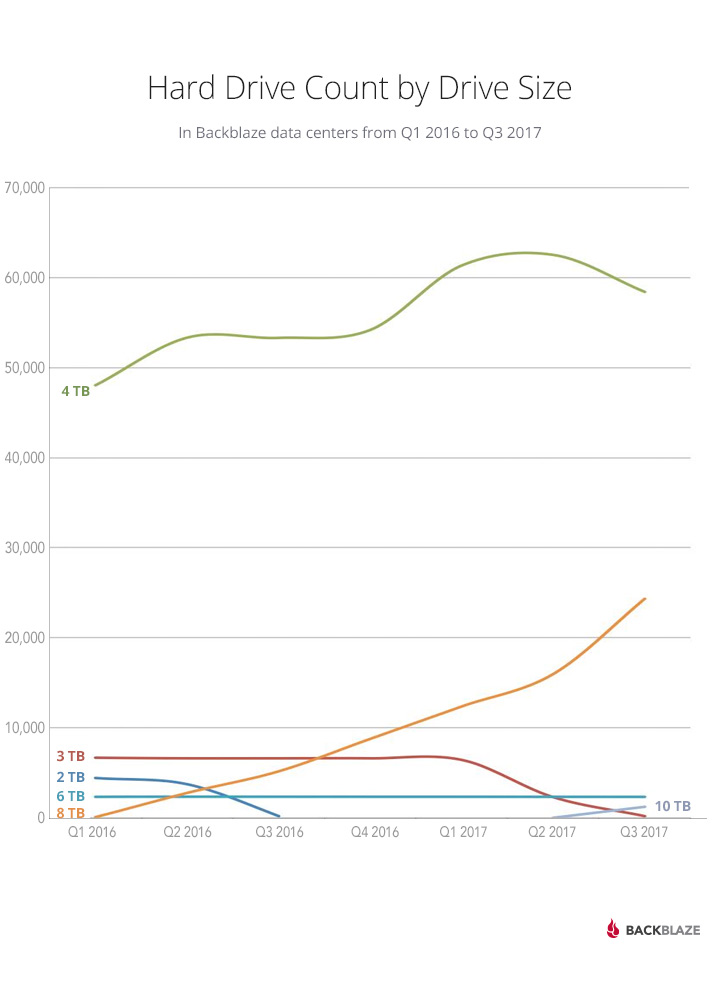
You clearly can see the retirement of the 2 TB and 3 TB drives, each being replaced predominantly by 8 TB drives. You also can see the beginning of the retirement curve for the 4 TB drives that will be replaced most likely by 12 TB drives over the coming months. A subset of the 4 TB drives, about 10,000 or so which were installed in the past year or so, will most likely stay in service for at least the next couple of years.
Lifetime Hard Drive Stats
The table below shows the failure rates for the hard drive models we had in service as of September 30, 2017. This is over the period beginning in April 2013 and ending September 30, 2017. If you are interested in the hard drive failure rates for all the hard drives we’ve used over the years, please refer to our 2016 hard drive review.
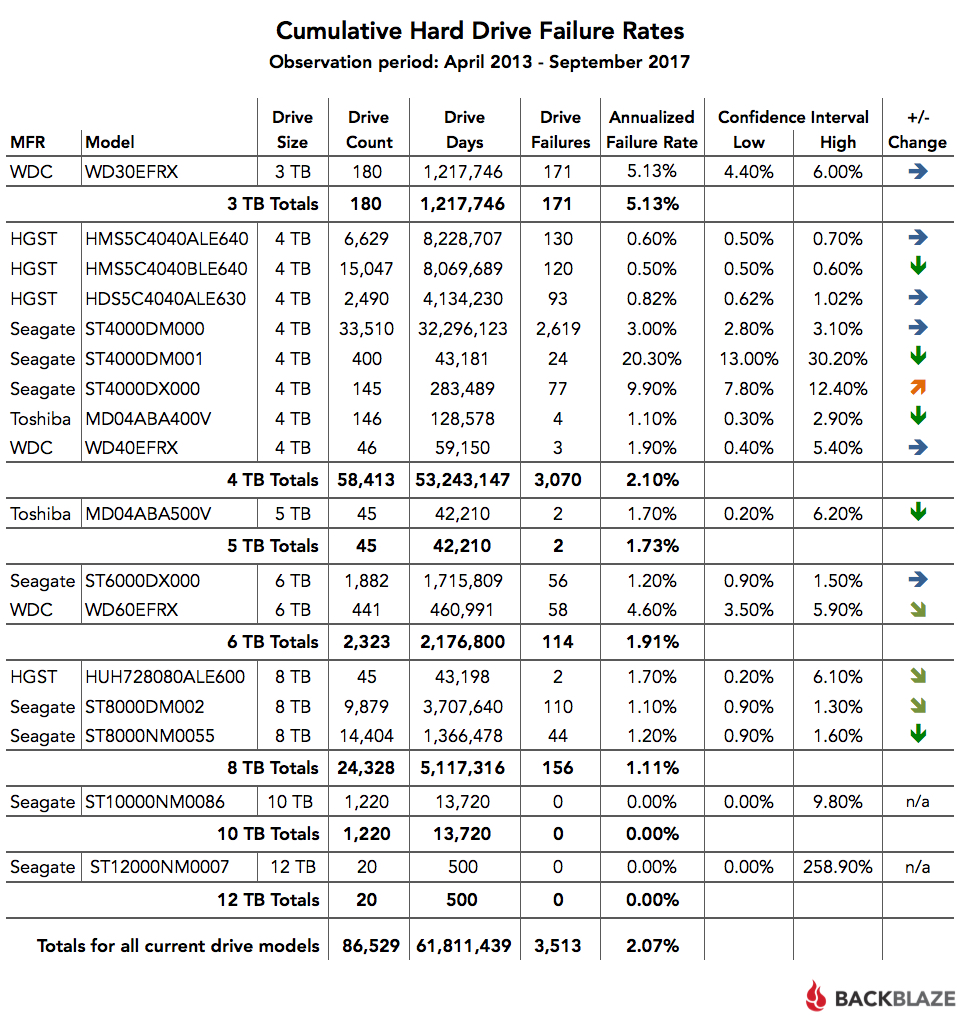
Note 1: The “+ / – Change” column reflects the change in the annualized failure rate from the previous quarter. Down is good, up is bad.
Note 2: You can download the data on this chart and the data from the “Hard Drive Failure Rates for Q3 2017” chart shown earlier in this review. The downloaded ZIP file contains one MSExcel spreadsheet.
The annualized failure rate for all of the drive models listed above is 2.07%; this is the higher than the 1.97% for the previous quarter. The primary driver behind this was the retirement of all of the HGST 3 TB drives (model: HDS5C3030ALA630) in Q3. Those drives had over 6 million drive days and an annualized failure rate of 0.82% — well below the average for the entire set of drives. Those drives now are gone and no longer part of the results.
Consumer Versus Enterprise Drives
The comparison of the consumer and enterprise Seagate 8 TB drives continues. Both of the drive models, Enterprise: ST8000NM0055 and Consumer: ST8000DM002, saw their annualized failure rates decrease from the previous quarter. In the case of the enterprise drives, this occurred even though we added 8,350 new drives in Q3. This brings the total number of Seagate 8 TB enterprise drives to 14,404, which have accumulated nearly 1.4 million drive days.
A comparison of the two drive models shows the annualized failure rates being very similar:
- 8 TB Consumer Drives: 1.1% Annualized Failure Rate
- 8 TB Enterprise Drives: 1.2% Annualized Failure Rate
Given that the failure rates for the two drive models appears to be similar, are the Seagate 8 TB enterprise drives worth any premium you might have to pay for them? As we have previously documented, the Seagate enterprise drives load data faster and have a number of features such as the PowerChoiceTM technology that can be very useful. In addition, enterprise drives typically have a 5 year warranty versus a 2 year warranty for the consumer drives. While drive price and availability are our primary considerations, you may decide other factors are more important.
We will continue to follow these drives, especially as they age over 2 years: the warranty point for the consumer drives.
Join the Drive Stats Webinar on Friday, November 3
We will be doing a deeper dive on this review in a webinar: “Q3 2017 Hard Drive Failure Stats” being held on Friday, November 3rd at 10:00 am Pacific Time. We’ll dig into what’s behind the numbers, including the enterprise vs consumer drive comparison. To sign up for the webinar, you will need to subscribe to the Backblaze BrightTALK channel if you haven’t already done so.
Wrapping Up
Our next drive stats post will be in January, when we’ll review the data for Q4 and all of 2017, and we’ll update our lifetime stats for all of the drives we have ever used. In addition, we’ll get our first real look at the 12 TB drives.
As a reminder, the hard drive data we use is available on our Hard Drive Test Data page. You can download and use this data for free for your own purpose. All we ask are three things 1) you cite Backblaze as the source if you use the data, 2) you accept that you are solely responsible for how you use the data, and 3) you do not sell this data to anyone: it is free.
Good luck and let us know if you find anything interesting.